
- Start >
- Rivers >
- Discharge >
- Isar >
- Rottersdorf >
- Chart of year

Chart of year Rottersdorf / Vils
Discharge from 23.05.2022 to 22.05.2023
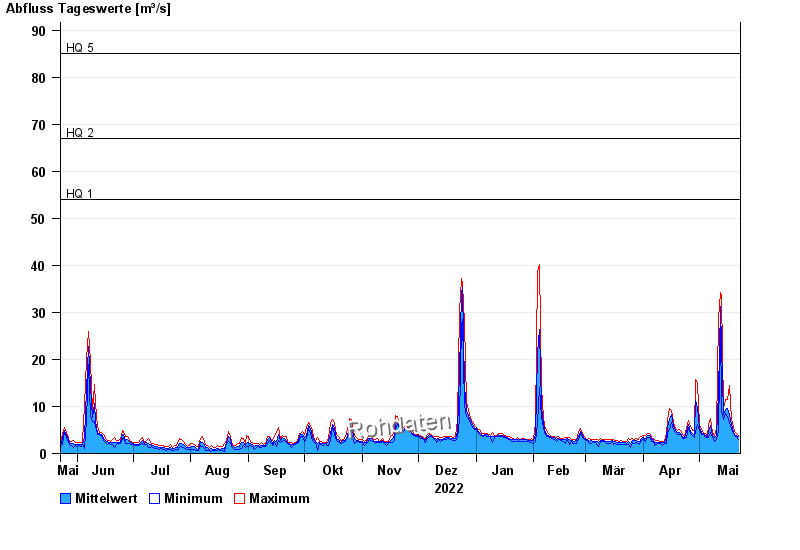
- HQ1 54 m³/s
- HQ2 67 m³/s
- HQ5 85 m³/s
- HQ10 98 m³/s
- HQ20 110 m³/s
| Date | Mean value [m³/s] | Maximum [m³/s] | Minimum [m³/s] |
|---|---|---|---|
| 22.05.2023 | 3.58 | 3.85 | 3.02 |
| 21.05.2023 | 3.91 | 4.22 | 3.66 |
| 20.05.2023 | 4.09 | 4.63 | 3.85 |
| 19.05.2023 | 4.67 | 5.55 | 4.22 |
| 18.05.2023 | 6.27 | 7.23 | 5.31 |
| 17.05.2023 | 8.37 | 14.4 | 6.64 |
| 16.05.2023 | 9.56 | 11.4 | 7.87 |
© Bayerisches Landesamt für Umwelt 2024