
- Start >
- Rivers >
- Discharge >
- Isar >
- Rottersdorf >
- Chart of year

Chart of year Rottersdorf / Vils
Discharge from 22.01.2020 to 21.01.2021
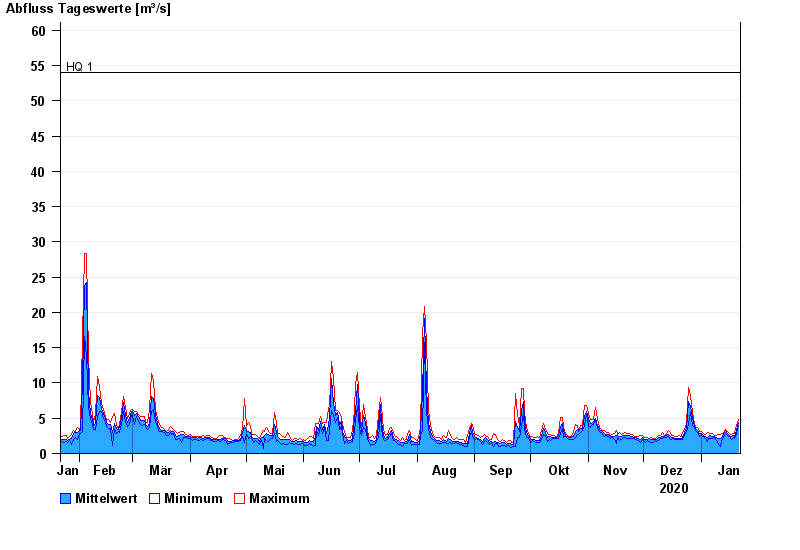
- HQ1 54 m³/s
- HQ2 67 m³/s
- HQ5 85 m³/s
- HQ10 98 m³/s
- HQ20 110 m³/s
| Date | Mean value [m³/s] | Maximum [m³/s] | Minimum [m³/s] |
|---|---|---|---|
| 21.01.2021 | 4.44 | 4.78 | 3.95 |
| 20.01.2021 | 3.26 | 3.95 | 2.81 |
| 19.01.2021 | 2.37 | 2.81 | 2.19 |
| 18.01.2021 | 2.5 | 2.81 | 2.31 |
| 17.01.2021 | 2.38 | 2.68 | 1.99 |
| 16.01.2021 | 2.61 | 2.82 | 2.43 |
| 15.01.2021 | 2.87 | 3.12 | 2.55 |
© Bayerisches Landesamt für Umwelt 2024