

Chart of year Rottach / Rottach
Discharge from 23.09.2020 to 22.09.2021
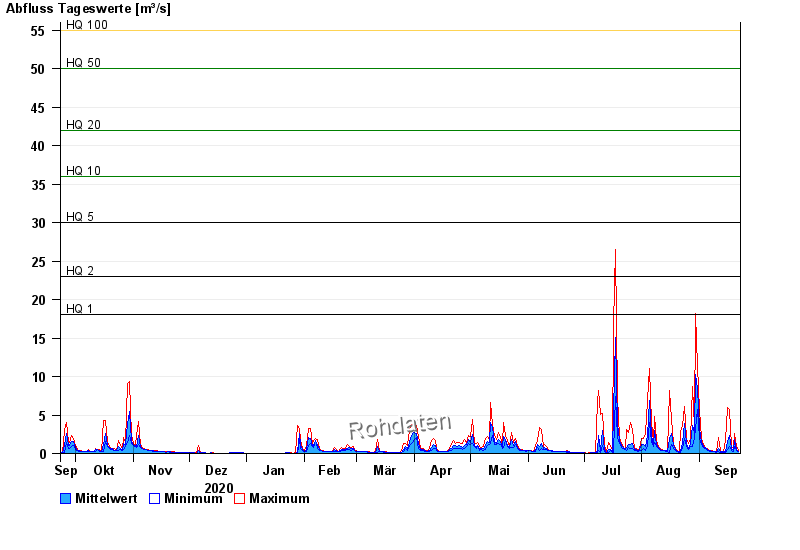
- HQ1 18 m³/s
- HQ2 23 m³/s
- HQ5 30 m³/s
- HQ10 36 m³/s
- HQ20 42 m³/s
- HQ50 50 m³/s
- HQ100 55 m³/s
| Date | Mean value [m³/s] | Maximum [m³/s] | Minimum [m³/s] |
|---|---|---|---|
| 22.09.2021 | 0.3 | 0.354 | 0.236 |
| 21.09.2021 | 0.565 | 0.903 | 0.354 |
| 20.09.2021 | 1.81 | 2.56 | 0.903 |
| 19.09.2021 | 0.343 | 0.797 | 0.29 |
| 18.09.2021 | 0.597 | 0.903 | 0.427 |
| 17.09.2021 | 2.32 | 5.69 | 0.903 |
| 16.09.2021 | 1.54 | 5.92 | 0.512 |
© Bayerisches Landesamt für Umwelt 2024