

Chart of year Rottach / Rottach
Discharge from 01.01.2019 to 31.12.2019
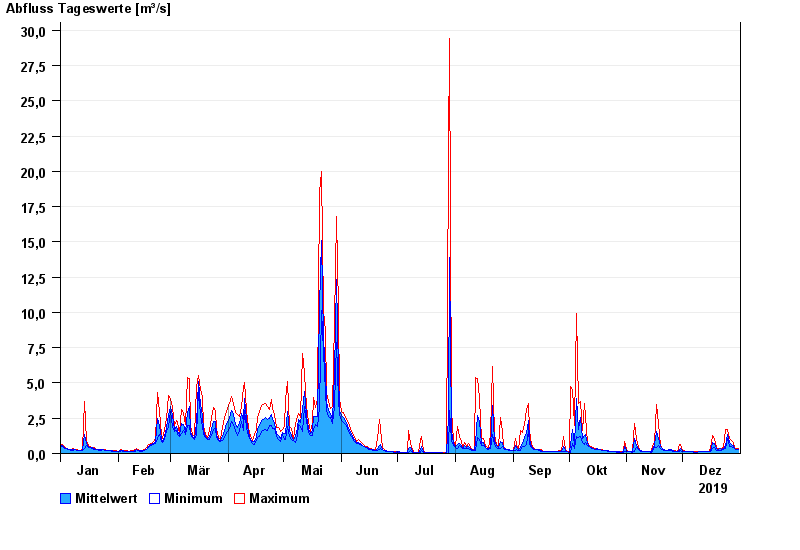
| Date | Mean value [m³/s] | Maximum [m³/s] | Minimum [m³/s] |
|---|---|---|---|
| 31.12.2019 | 0.3 | 0.36 | 0.298 |
| 30.12.2019 | 0.313 | 0.36 | 0.298 |
| 29.12.2019 | 0.384 | 0.429 | 0.36 |
| 28.12.2019 | 0.538 | 0.758 | 0.429 |
| 27.12.2019 | 0.651 | 0.956 | 0.503 |
| 26.12.2019 | 0.756 | 1.06 | 0.504 |
| 25.12.2019 | 1.36 | 1.67 | 1.06 |
© Bayerisches Landesamt für Umwelt 2024