

Chart of year Rottach / Rottach
Discharge from 01.01.2023 to 31.12.2023
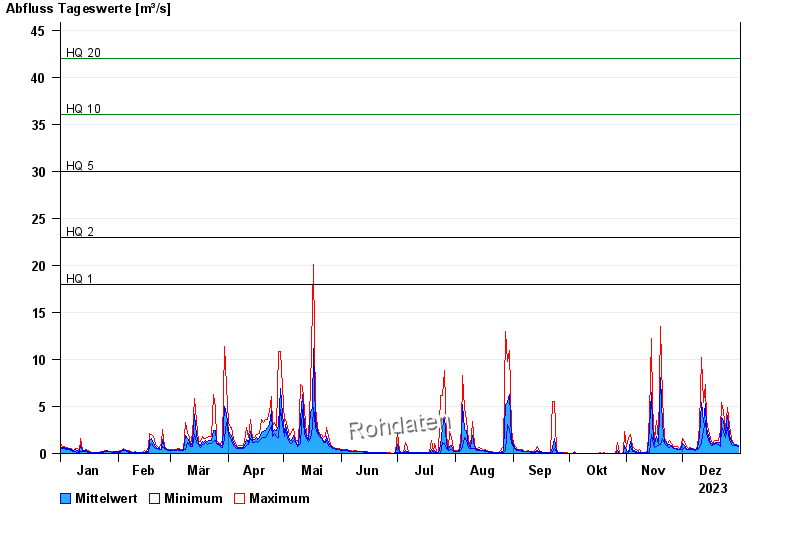
- HQ1 18 m³/s
- HQ2 23 m³/s
- HQ5 30 m³/s
- HQ10 36 m³/s
- HQ20 42 m³/s
- HQ50 50 m³/s
- HQ100 55 m³/s
| Date | Mean value [m³/s] | Maximum [m³/s] | Minimum [m³/s] |
|---|---|---|---|
| 31.12.2023 | 0.799 | 0.886 | 0.696 |
| 30.12.2023 | 0.927 | 0.989 | 0.886 |
| 29.12.2023 | 0.964 | 0.989 | 0.886 |
| 28.12.2023 | 1.02 | 1.1 | 0.886 |
| 27.12.2023 | 1.27 | 1.58 | 0.989 |
| 26.12.2023 | 1.95 | 2.96 | 1.33 |
| 25.12.2023 | 4.03 | 4.93 | 2.78 |
© Bayerisches Landesamt für Umwelt 2024