

Chart of total period Rottach / Rottach
Discharge from 01.11.1950 to 26.04.2024
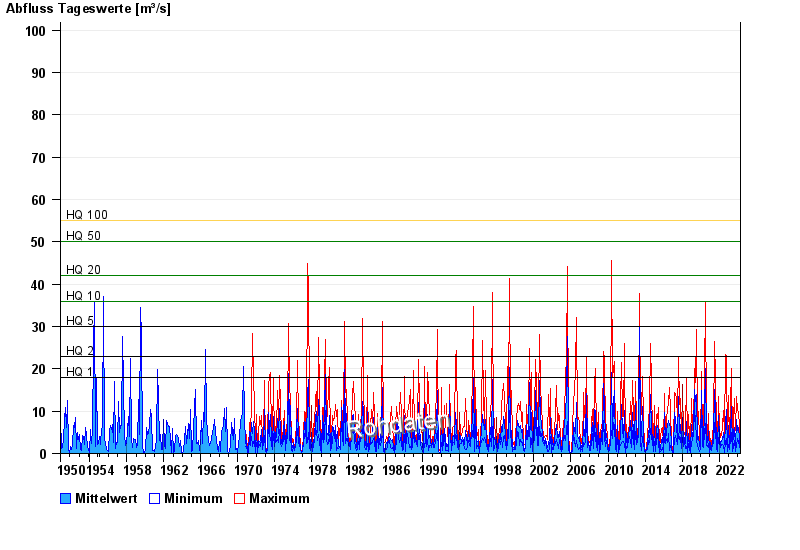
- HQ1 18 m³/s
- HQ2 23 m³/s
- HQ5 30 m³/s
- HQ10 36 m³/s
- HQ20 42 m³/s
- HQ50 50 m³/s
- HQ100 55 m³/s
| Date | Mean value [m³/s] | Maximum [m³/s] | Minimum [m³/s] |
|---|---|---|---|
| 26.04.2024 | 0.883 | 1.99 | 0.684 |
| 25.04.2024 | 0.696 | 0.779 | 0.598 |
| 24.04.2024 | 0.684 | 0.779 | 0.598 |
| 23.04.2024 | 0.748 | 0.875 | 0.684 |
| 22.04.2024 | 0.853 | 0.979 | 0.779 |
| 21.04.2024 | 0.894 | 0.979 | 0.779 |
| 20.04.2024 | 1.12 | 1.44 | 0.875 |
© Bayerisches Landesamt für Umwelt 2024