

Chart of year Rosenheim / Mangfall
Discharge from 03.12.2023 to 02.12.2024
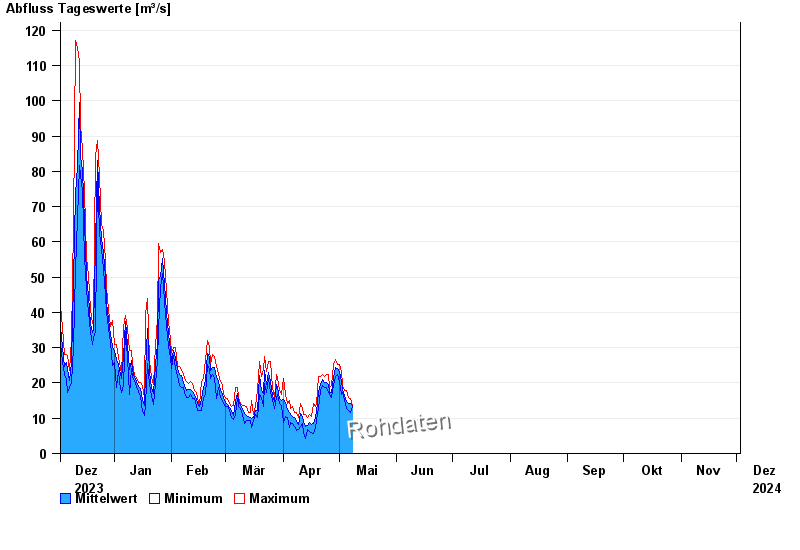
| Date | Mean value [m³/s] | Maximum [m³/s] | Minimum [m³/s] |
|---|---|---|---|
| 26.04.2024 | 17.4 | 18.6 | 16.7 |
| 25.04.2024 | 19.6 | 22.5 | 17.3 |
| 24.04.2024 | 20.1 | 22.5 | 18.6 |
| 23.04.2024 | 20 | 21.8 | 18.6 |
| 22.04.2024 | 20.3 | 22.5 | 18.6 |
| 21.04.2024 | 18.8 | 21.2 | 17.3 |
| 20.04.2024 | 16.5 | 21.8 | 11.1 |
© Bayerisches Landesamt für Umwelt 2024