

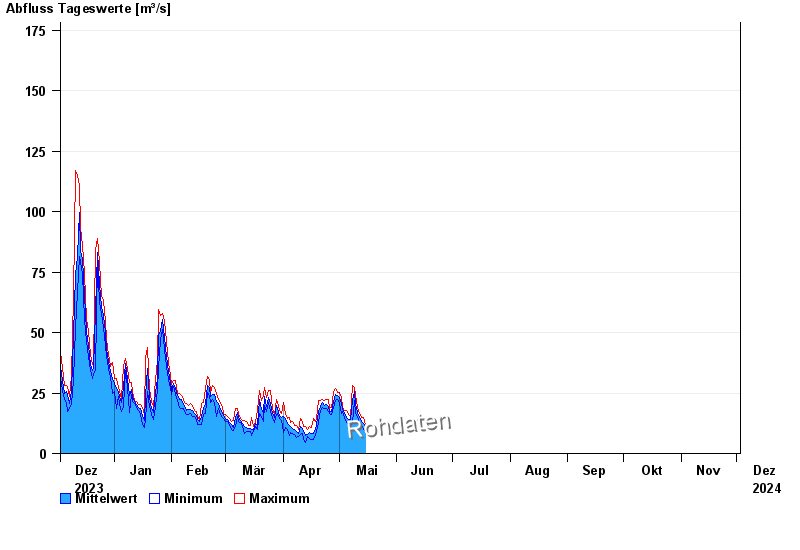
Chart of year Rosenheim / Mangfall
Discharge from 03.12.2023 to 02.12.2024
- 03.06.2013 Abfluss: 470 m³/s
- 04.08.2020 Abfluss: 420 m³/s
- 18.06.1979 Abfluss: 389 m³/s
- 22.05.1999 Abfluss: 383 m³/s
- 23.08.2005 Abfluss: 353 m³/s
| Date | Mean value [m³/s] | Maximum [m³/s] | Minimum [m³/s] |
|---|---|---|---|
| 04.06.2024 | 328 | 336 | 319 |
| 03.06.2024 | 148 | 336 | 62.4 |
| 02.06.2024 | 91.1 | 123 | 67.5 |
| 01.06.2024 | 97.8 | 136 | 51.5 |
| 31.05.2024 | 40 | 53.2 | 29.6 |
| 30.05.2024 | 19.5 | 32.6 | 16 |
| 29.05.2024 | 20.2 | 24.6 | 17.3 |
© Bayerisches Landesamt für Umwelt 2024