
- Start >
- Rivers >
- Discharge >
- Isar >
- Rißbachklamm >
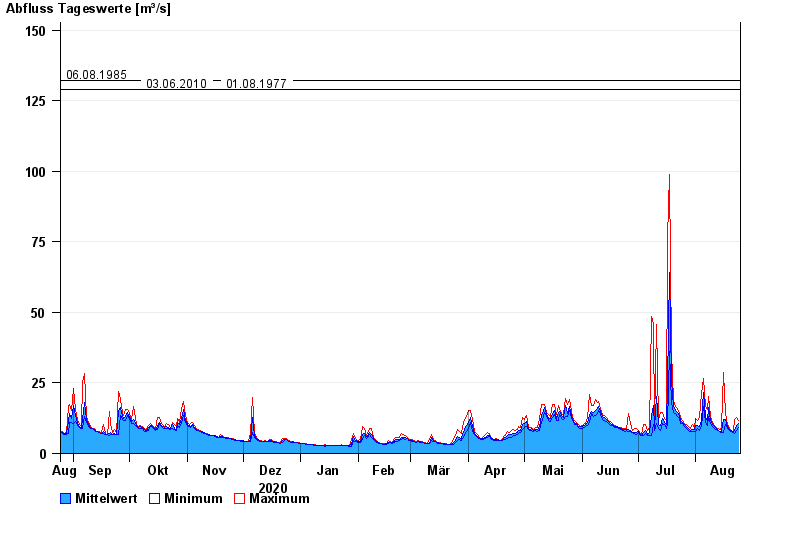
- Chart of year

Chart of year Rißbachklamm / Rißbach
Discharge from 25.08.2020 to 24.08.2021
- 23.08.2005 Abfluss: 208 m³/s
- 22.05.1999 Abfluss: 208 m³/s
- 06.08.1985 Abfluss: 132 m³/s
- 03.06.2010 Abfluss: 129 m³/s
- 01.08.1977 Abfluss: 129 m³/s
| Date | Mean value [m³/s] | Maximum [m³/s] | Minimum [m³/s] |
|---|---|---|---|
| 24.08.2021 | 10.7 | 11.8 | 9.29 |
| 23.08.2021 | 9.79 | 12.8 | 8.17 |
| 22.08.2021 | 7.99 | 12.1 | 7.12 |
| 21.08.2021 | 7.53 | 7.64 | 7.38 |
| 20.08.2021 | 7.99 | 8.17 | 7.64 |
| 19.08.2021 | 8.48 | 9 | 8.17 |
| 18.08.2021 | 9.46 | 10.2 | 8.72 |
© Bayerisches Landesamt für Umwelt 2024