

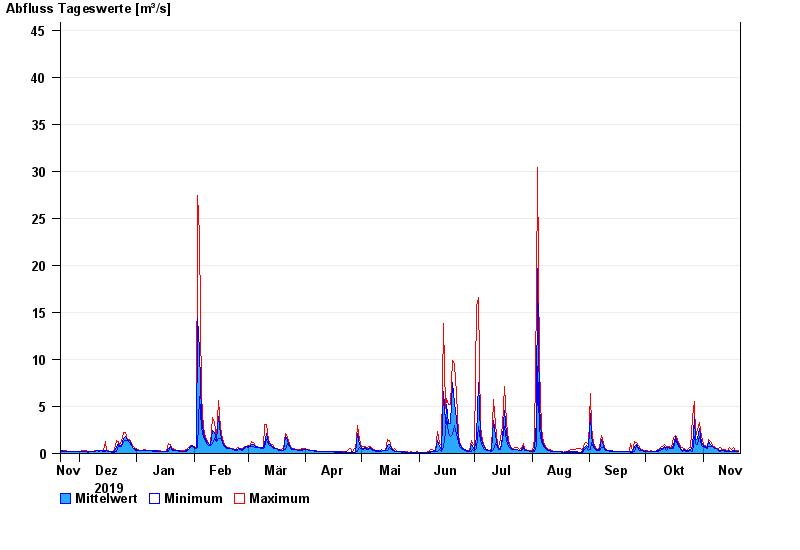
Chart of year Raisting / Rott
Discharge from 21.11.2019 to 20.11.2020
- 21.05.1999 Abfluss: 84,1 m³/s
- 18.06.1986 Abfluss: 77,7 m³/s
- 01.09.2002 Abfluss: 71 m³/s
- 29.05.2007 Abfluss: 51,5 m³/s
- 06.08.2000 Abfluss: 50,2 m³/s
| Date | Mean value [m³/s] | Maximum [m³/s] | Minimum [m³/s] |
|---|---|---|---|
| 20.11.2020 | 0.233 | 0.29 | 0.204 |
| 19.11.2020 | 0.24 | 0.291 | 0.204 |
| 18.11.2020 | 0.307 | 0.401 | 0.204 |
| 17.11.2020 | 0.329 | 0.637 | 0.18 |
| 16.11.2020 | 0.25 | 0.401 | 0.204 |
| 15.11.2020 | 0.31 | 0.585 | 0.23 |
| 14.11.2020 | 0.265 | 0.325 | 0.204 |
© Bayerisches Landesamt für Umwelt 2024