

Chart of year Raisting / Rott
Discharge from 20.07.2020 to 19.07.2021
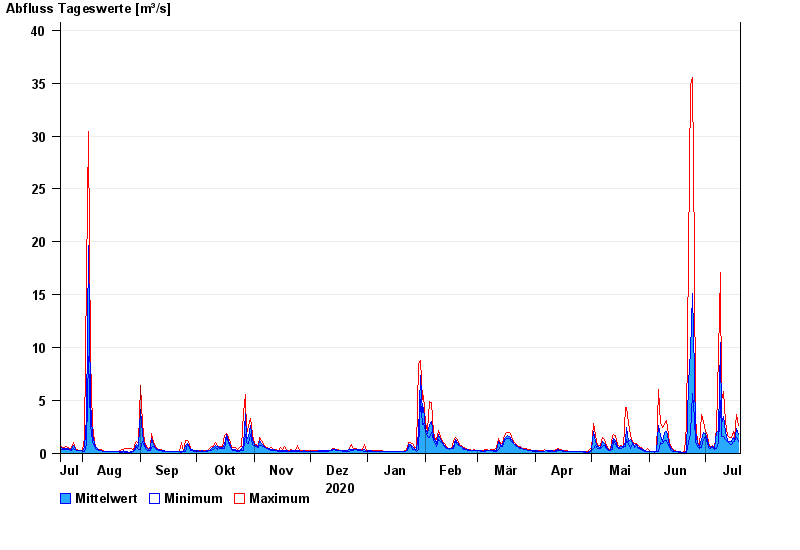
| Date | Mean value [m³/s] | Maximum [m³/s] | Minimum [m³/s] |
|---|---|---|---|
| 19.07.2021 | 1.79 | 2.65 | 1.16 |
| 18.07.2021 | 2.34 | 3.68 | 1.5 |
| 17.07.2021 | 1.16 | 1.5 | 1.09 |
| 16.07.2021 | 1.52 | 2.12 | 1.09 |
| 15.07.2021 | 1.12 | 1.5 | 0.896 |
| 14.07.2021 | 1.17 | 1.5 | 0.958 |
| 13.07.2021 | 1.25 | 1.72 | 1.09 |
© Bayerisches Landesamt für Umwelt 2024