

Chart of year Raisting / Rott
Discharge from 01.01.2022 to 31.12.2022
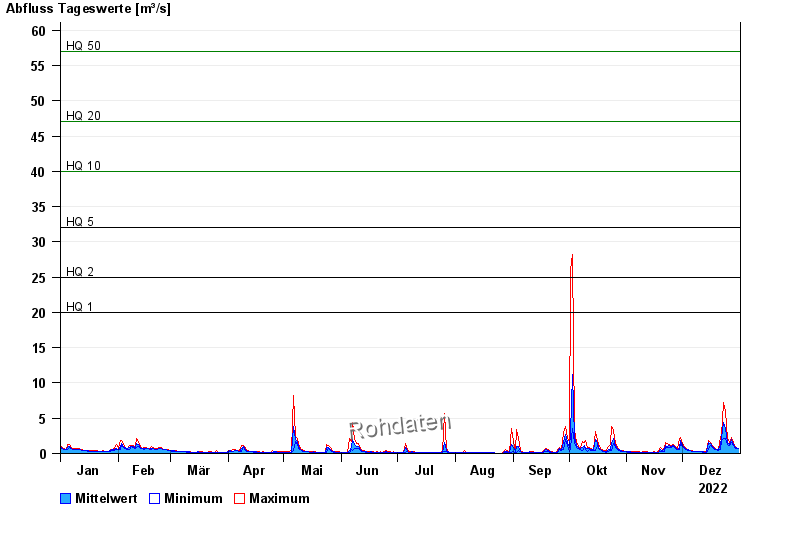
- HQ1 20 m³/s
- HQ2 25 m³/s
- HQ5 32 m³/s
- HQ10 40 m³/s
- HQ20 47 m³/s
- HQ50 57 m³/s
- HQ100 65 m³/s
| Date | Mean value [m³/s] | Maximum [m³/s] | Minimum [m³/s] |
|---|---|---|---|
| 31.12.2022 | 0.695 | 0.735 | 0.678 |
| 30.12.2022 | 0.802 | 0.851 | 0.735 |
| 29.12.2022 | 0.984 | 1.11 | 0.851 |
| 28.12.2022 | 1.34 | 1.6 | 1.11 |
| 27.12.2022 | 1.94 | 2.32 | 1.52 |
| 26.12.2022 | 1.21 | 1.52 | 1.11 |
| 25.12.2022 | 1.63 | 2.07 | 1.31 |
© Bayerisches Landesamt für Umwelt 2024