

Chart of year Raisting / Rott
Discharge from 25.04.2024 to 24.04.2025
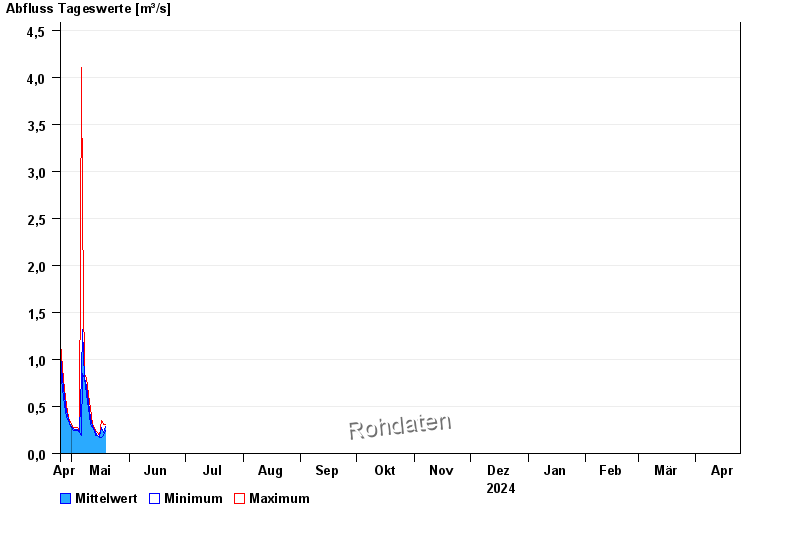
| Date | Mean value [m³/s] | Maximum [m³/s] | Minimum [m³/s] |
|---|---|---|---|
| 06.05.2024 | 0.215 | 0.218 | 0.193 |
| 05.05.2024 | 0.239 | 0.247 | 0.218 |
| 04.05.2024 | 0.253 | 0.278 | 0.247 |
| 03.05.2024 | 0.258 | 0.278 | 0.247 |
| 02.05.2024 | 0.269 | 0.278 | 0.247 |
| 01.05.2024 | 0.283 | 0.312 | 0.278 |
| 30.04.2024 | 0.318 | 0.348 | 0.312 |
© Bayerisches Landesamt für Umwelt 2024