

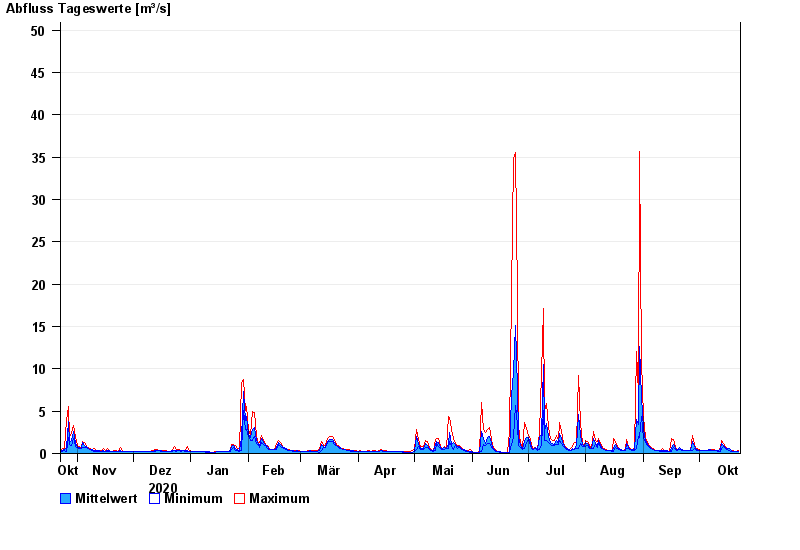
Chart of year Raisting / Rott
Discharge from 23.10.2020 to 22.10.2021
- 21.05.1999 Abfluss: 84,1 m³/s
- 18.06.1986 Abfluss: 77,7 m³/s
- 01.09.2002 Abfluss: 71 m³/s
- 29.05.2007 Abfluss: 51,5 m³/s
- 06.08.2000 Abfluss: 50,2 m³/s
| Date | Mean value [m³/s] | Maximum [m³/s] | Minimum [m³/s] |
|---|---|---|---|
| 22.10.2021 | 0.256 | 0.297 | 0.236 |
| 21.10.2021 | 0.234 | 0.236 | 0.209 |
| 20.10.2021 | 0.249 | 0.265 | 0.236 |
| 19.10.2021 | 0.269 | 0.297 | 0.265 |
| 18.10.2021 | 0.303 | 0.369 | 0.265 |
| 17.10.2021 | 0.566 | 0.644 | 0.369 |
| 16.10.2021 | 0.601 | 0.644 | 0.496 |
© Bayerisches Landesamt für Umwelt 2024