

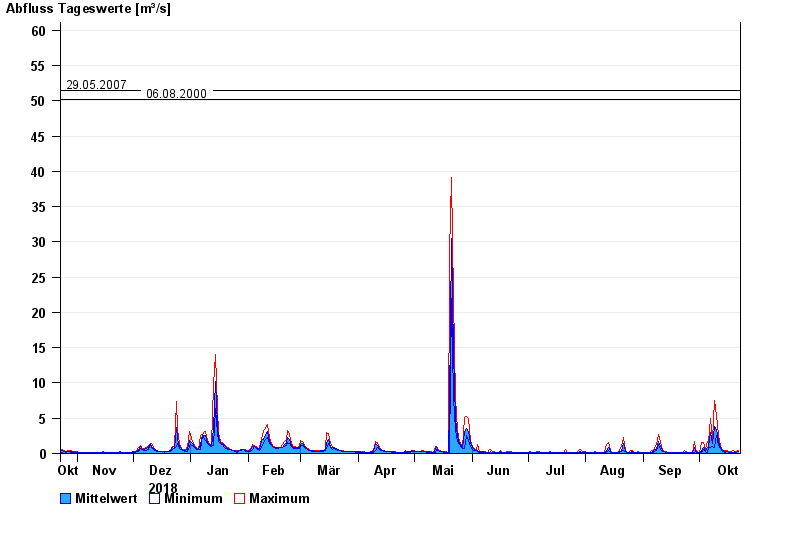
Chart of year Raisting / Rott
Discharge from 23.10.2018 to 22.10.2019
- 21.05.1999 Abfluss: 84,1 m³/s
- 18.06.1986 Abfluss: 77,7 m³/s
- 01.09.2002 Abfluss: 71 m³/s
- 29.05.2007 Abfluss: 51,5 m³/s
- 06.08.2000 Abfluss: 50,2 m³/s
| Date | Mean value [m³/s] | Maximum [m³/s] | Minimum [m³/s] |
|---|---|---|---|
| 22.10.2019 | 0.338 | 0.478 | 0.249 |
| 21.10.2019 | 0.201 | 0.314 | 0.132 |
| 20.10.2019 | 0.254 | 0.313 | 0.15 |
| 19.10.2019 | 0.208 | 0.389 | 0.15 |
| 18.10.2019 | 0.2 | 0.247 | 0.17 |
| 17.10.2019 | 0.21 | 0.247 | 0.17 |
| 16.10.2019 | 0.248 | 0.388 | 0.219 |
© Bayerisches Landesamt für Umwelt 2024