

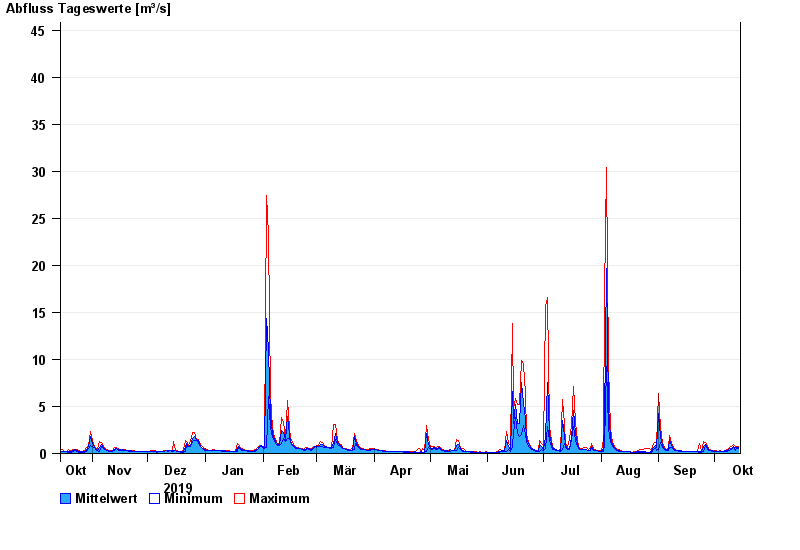
Chart of year Raisting / Rott
Discharge from 15.10.2019 to 14.10.2020
- 21.05.1999 Abfluss: 84,1 m³/s
- 18.06.1986 Abfluss: 77,7 m³/s
- 01.09.2002 Abfluss: 71 m³/s
- 29.05.2007 Abfluss: 51,5 m³/s
- 06.08.2000 Abfluss: 50,2 m³/s
| Date | Mean value [m³/s] | Maximum [m³/s] | Minimum [m³/s] |
|---|---|---|---|
| 14.10.2020 | 0.605 | 0.696 | 0.492 |
| 13.10.2020 | 0.632 | 0.696 | 0.59 |
| 12.10.2020 | 0.628 | 0.752 | 0.366 |
| 11.10.2020 | 0.734 | 0.995 | 0.59 |
| 10.10.2020 | 0.546 | 0.696 | 0.406 |
| 09.10.2020 | 0.483 | 0.642 | 0.329 |
| 08.10.2020 | 0.319 | 0.448 | 0.263 |
© Bayerisches Landesamt für Umwelt 2024