

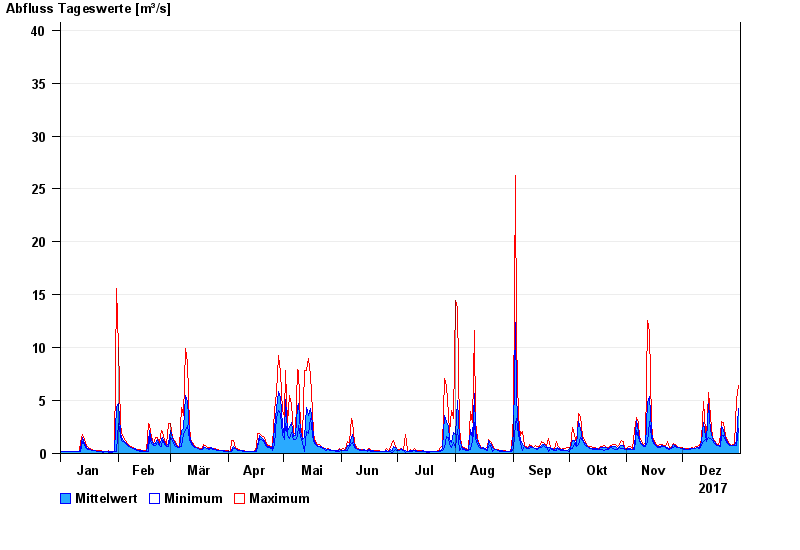
Chart of year Raisting / Rott
Discharge from 01.01.2017 to 31.12.2017
- 21.05.1999 Abfluss: 84,1 m³/s
- 18.06.1986 Abfluss: 77,7 m³/s
- 01.09.2002 Abfluss: 71 m³/s
- 29.05.2007 Abfluss: 51,5 m³/s
- 06.08.2000 Abfluss: 50,2 m³/s
| Date | Mean value [m³/s] | Maximum [m³/s] | Minimum [m³/s] |
|---|---|---|---|
| 31.12.2017 | 4.26 | 6.44 | 2.34 |
| 30.12.2017 | 1.23 | 5.15 | 0.727 |
| 29.12.2017 | 0.747 | 0.842 | 0.727 |
| 28.12.2017 | 0.776 | 0.842 | 0.727 |
| 27.12.2017 | 0.733 | 0.784 | 0.727 |
| 26.12.2017 | 0.829 | 0.904 | 0.784 |
| 25.12.2017 | 1.04 | 1.23 | 0.904 |
© Bayerisches Landesamt für Umwelt 2024