

Chart of year Raisting / Rott
Discharge from 23.10.2021 to 22.10.2022
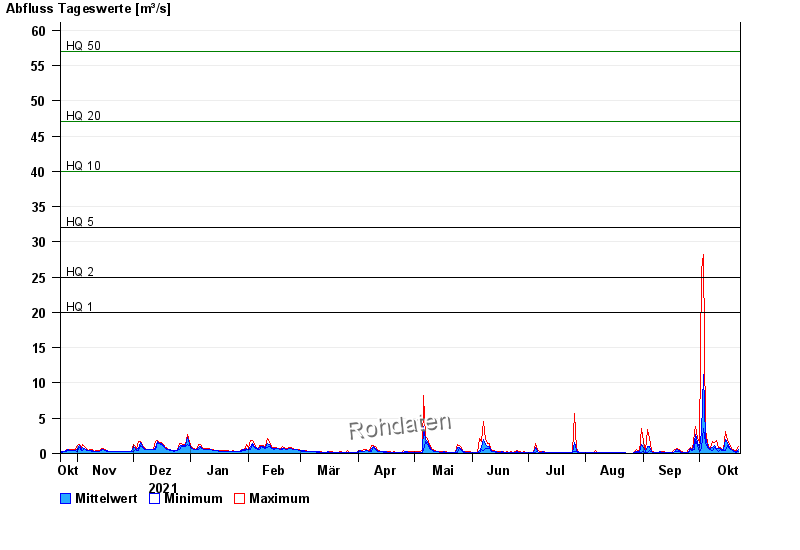
- HQ1 20 m³/s
- HQ2 25 m³/s
- HQ5 32 m³/s
- HQ10 40 m³/s
- HQ20 47 m³/s
- HQ50 57 m³/s
- HQ100 65 m³/s
| Date | Mean value [m³/s] | Maximum [m³/s] | Minimum [m³/s] |
|---|---|---|---|
| 22.10.2022 | 0.596 | 0.954 | 0.304 |
| 21.10.2022 | 0.311 | 0.418 | 0.188 |
| 20.10.2022 | 0.338 | 0.462 | 0.271 |
| 19.10.2022 | 0.437 | 0.607 | 0.271 |
| 18.10.2022 | 0.622 | 0.774 | 0.508 |
| 17.10.2022 | 0.907 | 1.22 | 0.716 |
| 16.10.2022 | 1.41 | 1.88 | 1.15 |
© Bayerisches Landesamt für Umwelt 2024