

Chart of year Raisting / Rott
Discharge from 19.10.2020 to 18.10.2021
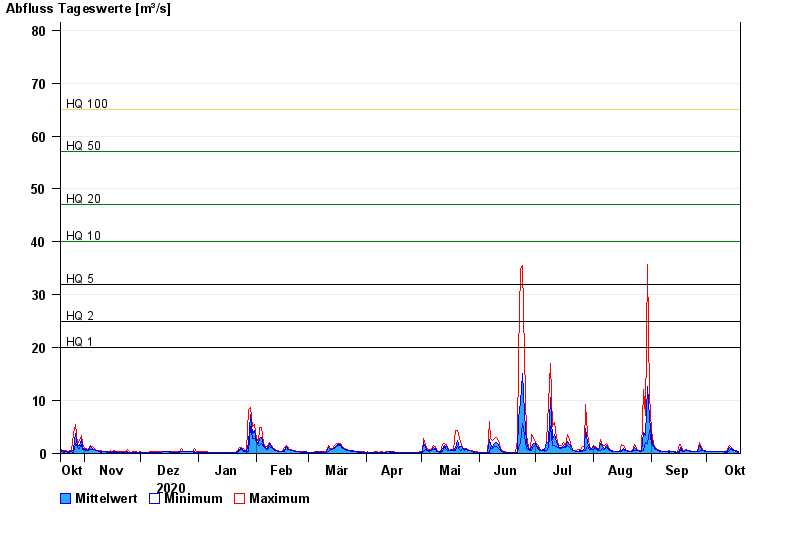
- HQ1 20 m³/s
- HQ2 25 m³/s
- HQ5 32 m³/s
- HQ10 40 m³/s
- HQ20 47 m³/s
- HQ50 57 m³/s
- HQ100 65 m³/s
| Date | Mean value [m³/s] | Maximum [m³/s] | Minimum [m³/s] |
|---|---|---|---|
| 18.10.2021 | 0.303 | 0.369 | 0.265 |
| 17.10.2021 | 0.566 | 0.644 | 0.369 |
| 16.10.2021 | 0.601 | 0.644 | 0.496 |
| 15.10.2021 | 0.698 | 0.812 | 0.593 |
| 14.10.2021 | 0.979 | 1.19 | 0.812 |
| 13.10.2021 | 1.15 | 1.54 | 0.644 |
| 12.10.2021 | 0.435 | 0.698 | 0.265 |
© Bayerisches Landesamt für Umwelt 2024