

Chart of year Raisting / Rott
Discharge from 19.10.2018 to 18.10.2019
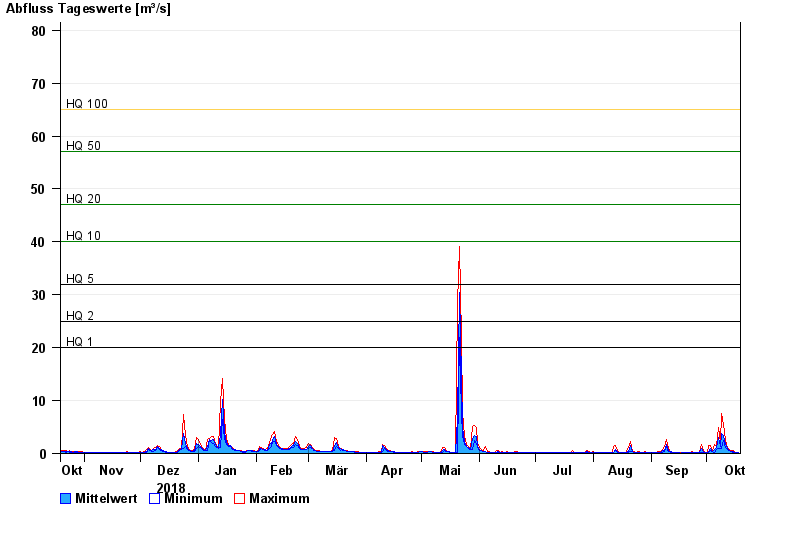
- HQ1 20 m³/s
- HQ2 25 m³/s
- HQ5 32 m³/s
- HQ10 40 m³/s
- HQ20 47 m³/s
- HQ50 57 m³/s
- HQ100 65 m³/s
| Date | Mean value [m³/s] | Maximum [m³/s] | Minimum [m³/s] |
|---|---|---|---|
| 18.10.2019 | 0.2 | 0.247 | 0.17 |
| 17.10.2019 | 0.21 | 0.247 | 0.17 |
| 16.10.2019 | 0.248 | 0.388 | 0.219 |
| 15.10.2019 | 0.31 | 0.475 | 0.193 |
| 14.10.2019 | 0.389 | 0.475 | 0.349 |
| 13.10.2019 | 0.546 | 0.679 | 0.475 |
| 12.10.2019 | 0.872 | 1.11 | 0.679 |
© Bayerisches Landesamt für Umwelt 2024