

Chart of year Puppling / Isar
Discharge from 26.07.2020 to 25.07.2021
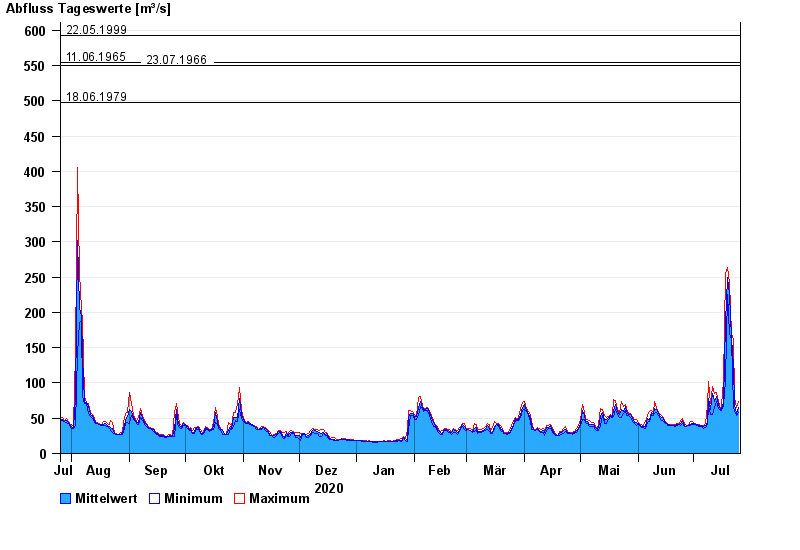
- 24.08.2005 Abfluss: 689 m³/s
- 22.05.1999 Abfluss: 592 m³/s
- 11.06.1965 Abfluss: 554 m³/s
- 23.07.1966 Abfluss: 550 m³/s
- 18.06.1979 Abfluss: 498 m³/s
| Date | Mean value [m³/s] | Maximum [m³/s] | Minimum [m³/s] |
|---|---|---|---|
| 25.07.2021 | 65.2 | 73.9 | 57.7 |
| 24.07.2021 | 57.1 | 65.8 | 54.2 |
| 23.07.2021 | 69.8 | 78.7 | 59.2 |
| 22.07.2021 | 123 | 162 | 65.5 |
| 21.07.2021 | 165 | 170 | 162 |
| 20.07.2021 | 225 | 243 | 170 |
| 19.07.2021 | 249 | 263 | 225 |
© Bayerisches Landesamt für Umwelt 2024