

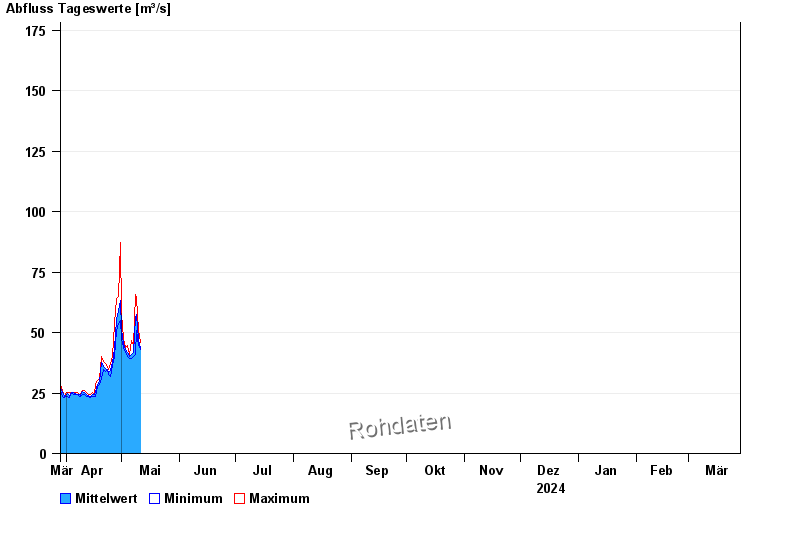
Chart of year Puppling / Isar
Discharge from 29.03.2024 to 28.03.2025
- HQ5 400 m³/s
- HQ10 470 m³/s
- HQ20 540 m³/s
- HQ100 690 m³/s
| Date | Mean value [m³/s] | Maximum [m³/s] | Minimum [m³/s] |
|---|---|---|---|
| 13.05.2024 | 37.6 | 38.2 | 37.3 |
| 12.05.2024 | 40.9 | 43.8 | 38.2 |
| 11.05.2024 | 43.4 | 45.8 | 42.9 |
| 10.05.2024 | 47.2 | 50.7 | 44.8 |
| 09.05.2024 | 57.4 | 63.9 | 50.7 |
| 08.05.2024 | 56.1 | 65.9 | 41 |
| 07.05.2024 | 41.8 | 44.8 | 40.1 |
© Bayerisches Landesamt für Umwelt 2024