

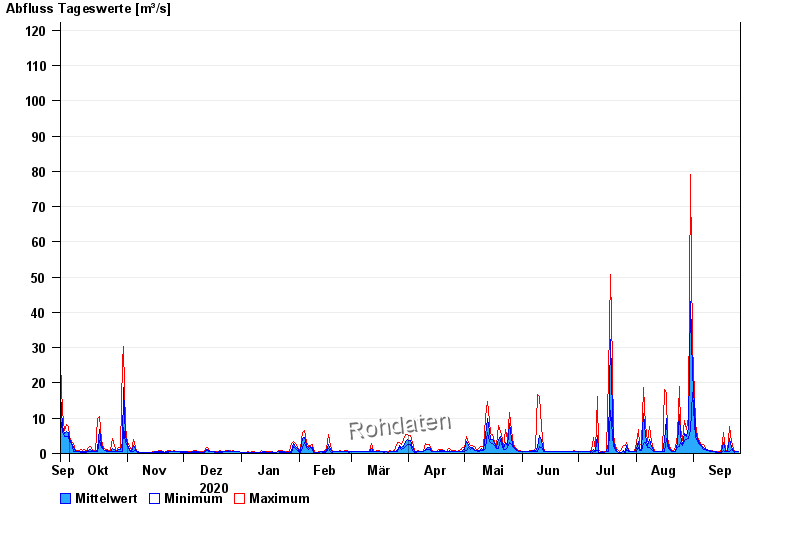
Chart of year Prien / Prien
Discharge from 26.09.2020 to 25.09.2021
- 31.07.1924 Abfluss: 180 m³/s
- 01.01.1940 Abfluss: 165 m³/s
- 02.06.2013 Abfluss: 163 m³/s
- 12.08.2002 Abfluss: 160 m³/s
- 03.06.2010 Abfluss: 135 m³/s
| Date | Mean value [m³/s] | Maximum [m³/s] | Minimum [m³/s] |
|---|---|---|---|
| 25.09.2021 | 0.491 | 0.591 | 0.442 |
| 24.09.2021 | 0.494 | 0.644 | 0.442 |
| 23.09.2021 | 0.486 | 0.591 | 0.397 |
| 22.09.2021 | 0.734 | 1.02 | 0.591 |
| 21.09.2021 | 1.79 | 3.29 | 1.02 |
| 20.09.2021 | 4.12 | 7.63 | 0.539 |
| 19.09.2021 | 0.467 | 0.539 | 0.442 |
© Bayerisches Landesamt für Umwelt 2024