

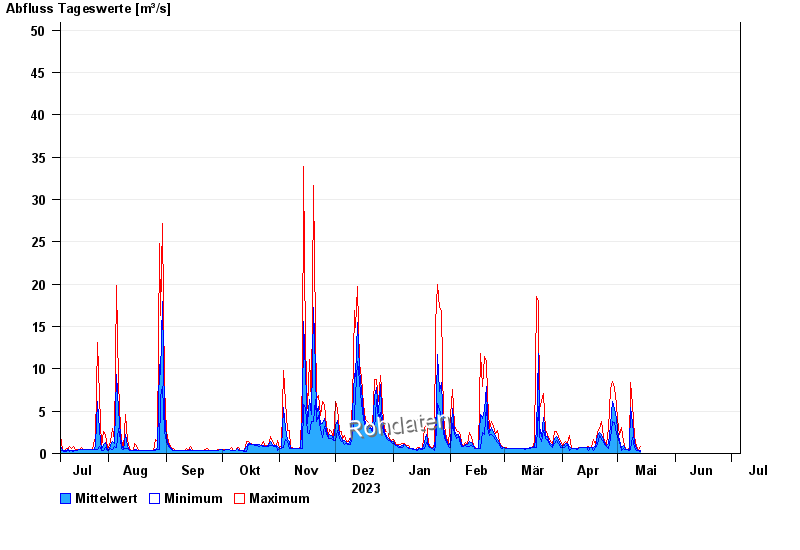
Chart of year Prien / Prien
Discharge from 06.07.2023 to 05.07.2024
- 31.07.1924 Abfluss: 180 m³/s
- 01.01.1940 Abfluss: 165 m³/s
- 02.06.2013 Abfluss: 163 m³/s
- 12.08.2002 Abfluss: 160 m³/s
- 03.06.2010 Abfluss: 135 m³/s
| Date | Mean value [m³/s] | Maximum [m³/s] | Minimum [m³/s] |
|---|---|---|---|
| 29.04.2024 | 7.33 | 7.74 | 7.04 |
| 28.04.2024 | 6.1 | 8.48 | 3.8 |
| 27.04.2024 | 3.3 | 7.51 | 1.81 |
| 26.04.2024 | 1.16 | 2.95 | 0.608 |
| 25.04.2024 | 0.993 | 1.12 | 0.843 |
| 24.04.2024 | 1.3 | 1.44 | 1.12 |
| 23.04.2024 | 1.6 | 1.91 | 1.36 |
© Bayerisches Landesamt für Umwelt 2024