

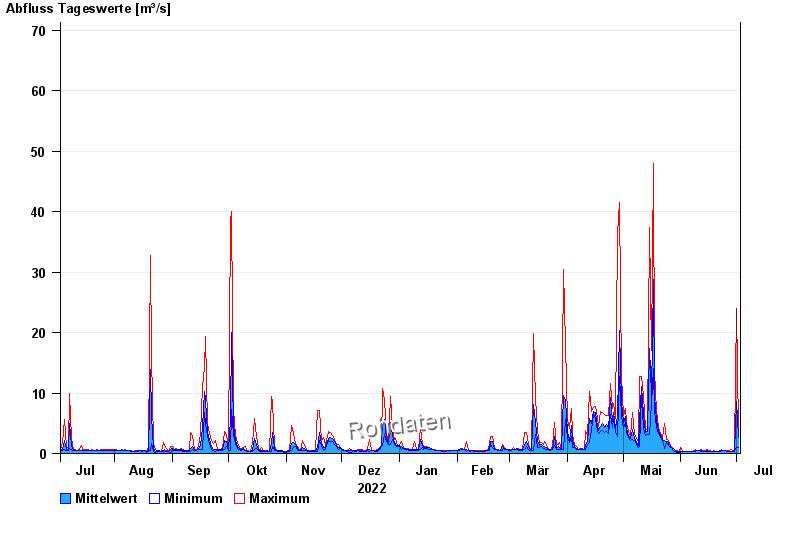
Chart of year Prien / Prien
Discharge from 03.07.2022 to 02.07.2023
- 31.07.1924 Abfluss: 180 m³/s
- 01.01.1940 Abfluss: 165 m³/s
- 02.06.2013 Abfluss: 163 m³/s
- 12.08.2002 Abfluss: 160 m³/s
- 03.06.2010 Abfluss: 135 m³/s
| Date | Mean value [m³/s] | Maximum [m³/s] | Minimum [m³/s] |
|---|---|---|---|
| 02.07.2023 | 2.61 | 3.96 | 1.07 |
| 01.07.2023 | 8.66 | 24 | 0.945 |
| 30.06.2023 | 0.384 | 0.773 | 0.344 |
| 29.06.2023 | 0.372 | 0.379 | 0.344 |
| 28.06.2023 | 0.412 | 0.579 | 0.249 |
| 27.06.2023 | 0.372 | 0.415 | 0.344 |
| 26.06.2023 | 0.388 | 0.415 | 0.344 |
© Bayerisches Landesamt für Umwelt 2024