

Chart of year Prien / Prien
Discharge from 02.07.2021 to 01.07.2022
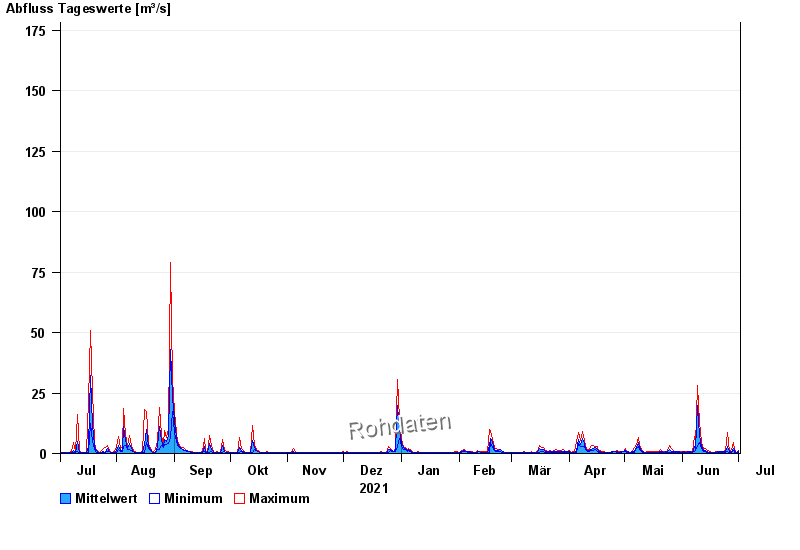 Für diesen Pegel sind keine Jährlichkeiten hinterlegt.
| Date | Mean value [m³/s] | Maximum [m³/s] | Minimum [m³/s] |
|---|---|---|---|
| 01.07.2022 | 0.687 | 1.29 | 0.562 |
| 30.06.2022 | 0.564 | 0.616 | 0.562 |
| 29.06.2022 | 1.06 | 1.83 | 0.562 |
| 28.06.2022 | 2.17 | 4.67 | 1.06 |
| 27.06.2022 | 0.696 | 1.64 | 0.616 |
| 26.06.2022 | 0.646 | 0.672 | 0.616 |
| 25.06.2022 | 2.69 | 8.8 | 0.672 |
© Bayerisches Landesamt für Umwelt 2024