
- Start >
- Rivers >
- Discharge >
- Isar >
- Pfaffenhofen >
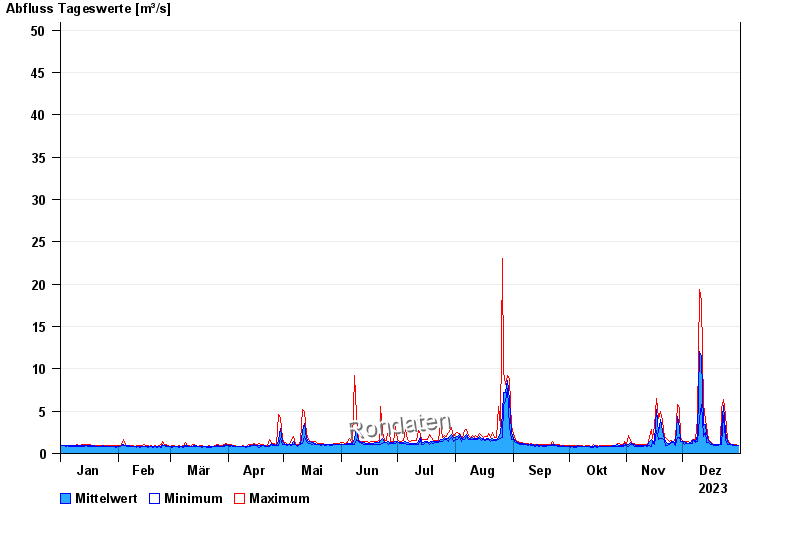
- Chart of year

Chart of year Pfaffenhofen / Ilm
Discharge from 01.01.2023 to 31.12.2023
 Für diesen Pegel sind keine Jährlichkeiten hinterlegt.
| Date | Mean value [m³/s] | Maximum [m³/s] | Minimum [m³/s] |
|---|---|---|---|
| 31.12.2023 | 0.962 | 0.964 | 0.917 |
| 30.12.2023 | 0.967 | 1.01 | 0.917 |
| 29.12.2023 | 0.992 | 1.06 | 0.964 |
| 28.12.2023 | 1.02 | 1.06 | 0.964 |
| 27.12.2023 | 1.07 | 1.11 | 1.06 |
| 26.12.2023 | 1.16 | 1.28 | 1.01 |
| 25.12.2023 | 1.43 | 1.69 | 1.01 |
© Bayerisches Landesamt für Umwelt 2024