

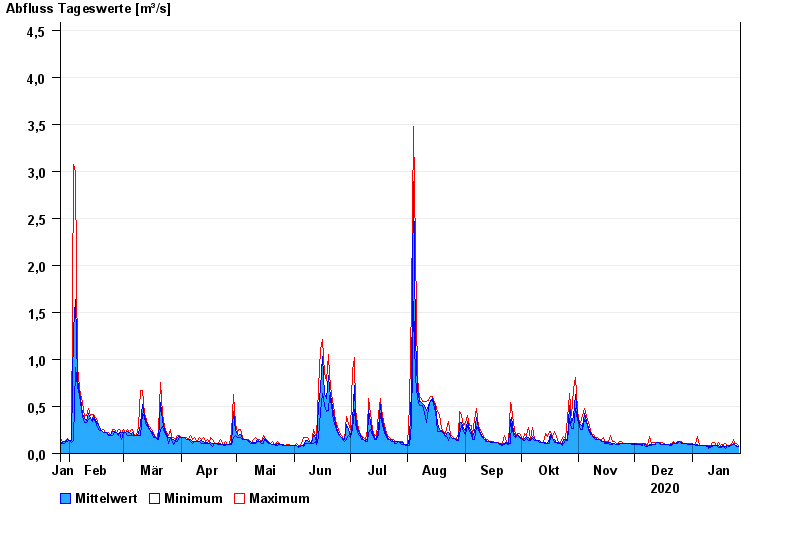
Chart of year Percha / Lüßbach
Discharge from 27.01.2020 to 26.01.2021
- 18.06.1979 Abfluss: 12,5 m³/s
- 19.07.1999 Abfluss: 8,92 m³/s
- 23.08.2005 Abfluss: 6,43 m³/s
- 22.05.1999 Abfluss: 6,26 m³/s
- 29.05.2007 Abfluss: 6,05 m³/s
| Date | Mean value [m³/s] | Maximum [m³/s] | Minimum [m³/s] |
|---|---|---|---|
| 26.01.2021 | 0.078 | 0.082 | 0.071 |
| 25.01.2021 | 0.085 | 0.109 | 0.071 |
| 24.01.2021 | 0.096 | 0.109 | 0.095 |
| 23.01.2021 | 0.102 | 0.145 | 0.095 |
| 22.01.2021 | 0.087 | 0.096 | 0.083 |
| 21.01.2021 | 0.082 | 0.084 | 0.073 |
| 20.01.2021 | 0.084 | 0.084 | 0.084 |
© Bayerisches Landesamt für Umwelt 2024