

Chart of year Percha / Lüßbach
Discharge from 22.10.2019 to 21.10.2020
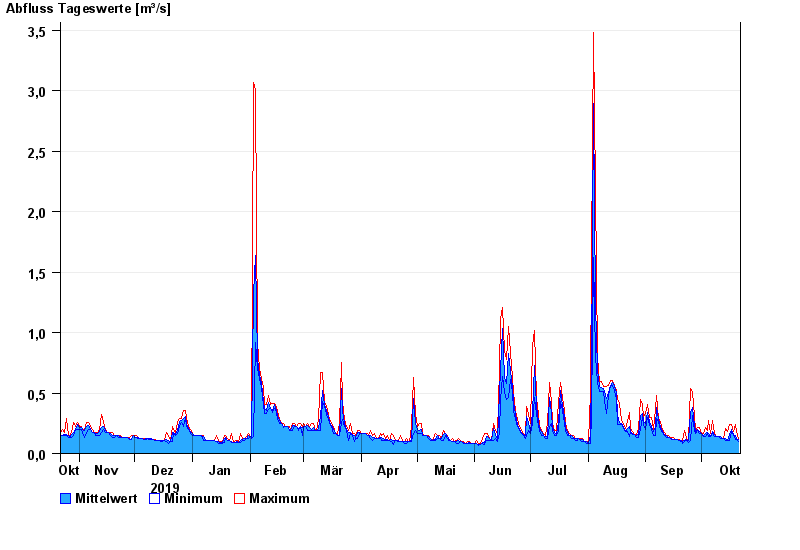
| Date | Mean value [m³/s] | Maximum [m³/s] | Minimum [m³/s] |
|---|---|---|---|
| 21.10.2020 | 0.115 | 0.118 | 0.103 |
| 20.10.2020 | 0.122 | 0.18 | 0.118 |
| 19.10.2020 | 0.145 | 0.237 | 0.119 |
| 18.10.2020 | 0.161 | 0.181 | 0.157 |
| 17.10.2020 | 0.2 | 0.238 | 0.181 |
| 16.10.2020 | 0.159 | 0.238 | 0.104 |
| 15.10.2020 | 0.108 | 0.182 | 0.104 |
© Bayerisches Landesamt für Umwelt 2024