

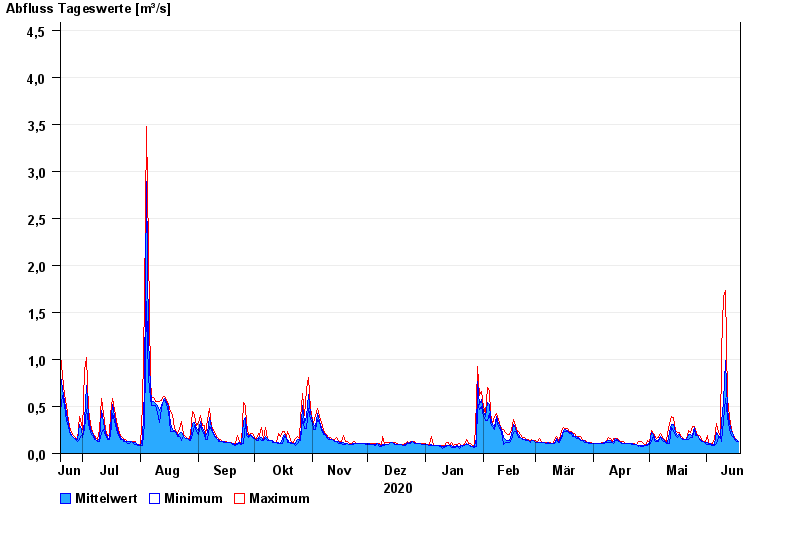
Chart of year Percha / Lüßbach
Discharge from 19.06.2020 to 18.06.2021
- 18.06.1979 Abfluss: 12,5 m³/s
- 19.07.1999 Abfluss: 8,92 m³/s
- 23.08.2005 Abfluss: 6,43 m³/s
- 22.05.1999 Abfluss: 6,26 m³/s
- 29.05.2007 Abfluss: 6,05 m³/s
| Date | Mean value [m³/s] | Maximum [m³/s] | Minimum [m³/s] |
|---|---|---|---|
| 18.06.2021 | 0.129 | 0.129 | 0.129 |
| 17.06.2021 | 0.144 | 0.148 | 0.129 |
| 16.06.2021 | 0.162 | 0.17 | 0.148 |
| 15.06.2021 | 0.189 | 0.195 | 0.17 |
| 14.06.2021 | 0.232 | 0.253 | 0.194 |
| 13.06.2021 | 0.324 | 0.392 | 0.253 |
| 12.06.2021 | 0.471 | 0.586 | 0.392 |
© Bayerisches Landesamt für Umwelt 2024