

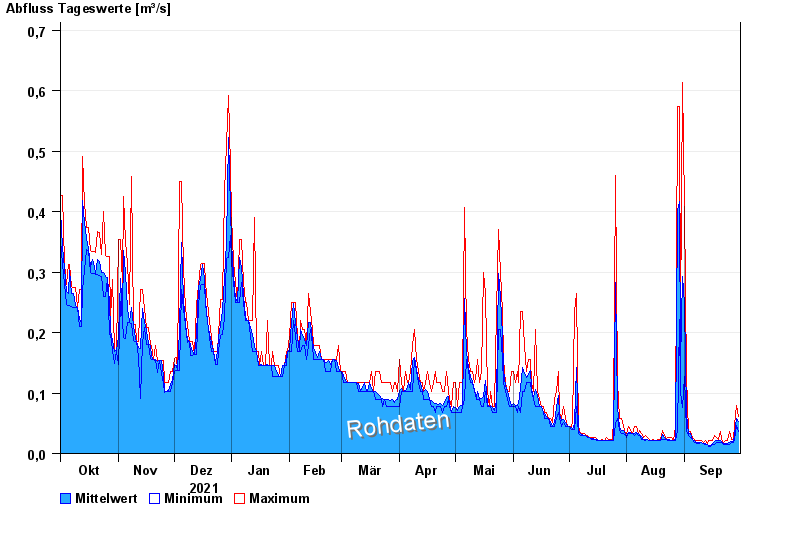
Chart of year Percha / Lüßbach
Discharge from 01.10.2021 to 30.09.2022
- 18.06.1979 Abfluss: 12,5 m³/s
- 19.07.1999 Abfluss: 8,92 m³/s
- 23.08.2005 Abfluss: 6,43 m³/s
- 22.05.1999 Abfluss: 6,26 m³/s
- 29.05.2007 Abfluss: 6,05 m³/s
| Date | Mean value [m³/s] | Maximum [m³/s] | Minimum [m³/s] |
|---|---|---|---|
| 30.09.2022 | 0.054 | 0.061 | 0.036 |
| 29.09.2022 | 0.058 | 0.08 | 0.046 |
| 28.09.2022 | 0.032 | 0.046 | 0.023 |
| 27.09.2022 | 0.02 | 0.023 | 0.018 |
| 26.09.2022 | 0.019 | 0.023 | 0.018 |
| 25.09.2022 | 0.017 | 0.036 | 0.015 |
| 24.09.2022 | 0.016 | 0.021 | 0.015 |
© Bayerisches Landesamt für Umwelt 2024