

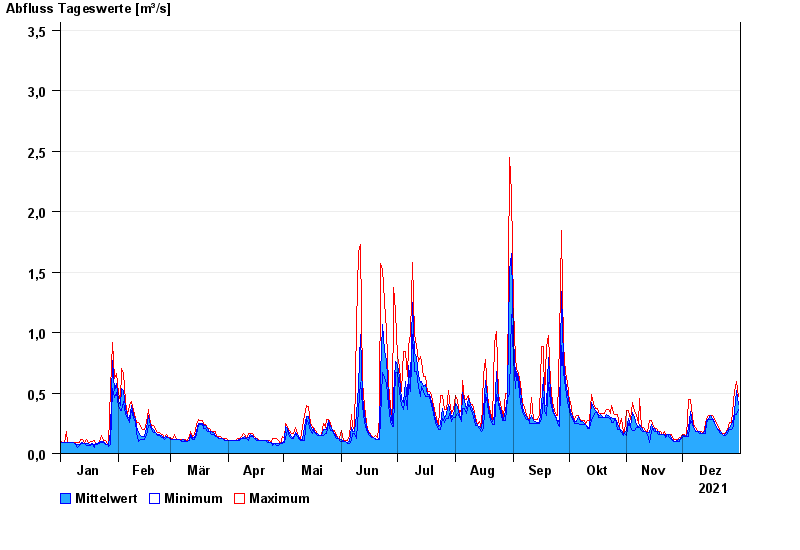
Chart of year Percha / Lüßbach
Discharge from 01.01.2021 to 31.12.2021
- 18.06.1979 Abfluss: 12,5 m³/s
- 19.07.1999 Abfluss: 8,92 m³/s
- 23.08.2005 Abfluss: 6,43 m³/s
- 22.05.1999 Abfluss: 6,26 m³/s
- 29.05.2007 Abfluss: 6,05 m³/s
| Date | Mean value [m³/s] | Maximum [m³/s] | Minimum [m³/s] |
|---|---|---|---|
| 31.12.2021 | 0.405 | 0.473 | 0.361 |
| 30.12.2021 | 0.522 | 0.592 | 0.324 |
| 29.12.2021 | 0.349 | 0.511 | 0.323 |
| 28.12.2021 | 0.289 | 0.433 | 0.224 |
| 27.12.2021 | 0.236 | 0.254 | 0.196 |
| 26.12.2021 | 0.214 | 0.254 | 0.195 |
| 25.12.2021 | 0.191 | 0.195 | 0.169 |
© Bayerisches Landesamt für Umwelt 2024