

Chart of year Percha / Lüßbach
Discharge from 24.07.2021 to 23.07.2022
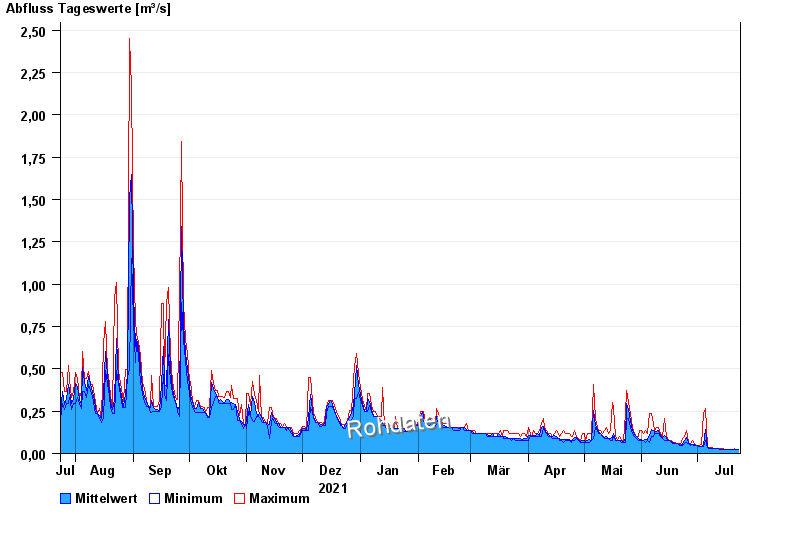
| Date | Mean value [m³/s] | Maximum [m³/s] | Minimum [m³/s] |
|---|---|---|---|
| 23.07.2022 | 0.022 | 0.023 | 0.021 |
| 22.07.2022 | 0.021 | 0.023 | 0.021 |
| 21.07.2022 | 0.022 | 0.027 | 0.021 |
| 20.07.2022 | 0.021 | 0.021 | 0.021 |
| 19.07.2022 | 0.021 | 0.023 | 0.021 |
| 18.07.2022 | 0.021 | 0.021 | 0.021 |
| 17.07.2022 | 0.021 | 0.021 | 0.021 |
© Bayerisches Landesamt für Umwelt 2024