

Chart of year Percha / Lüßbach
Discharge from 21.09.2019 to 20.09.2020
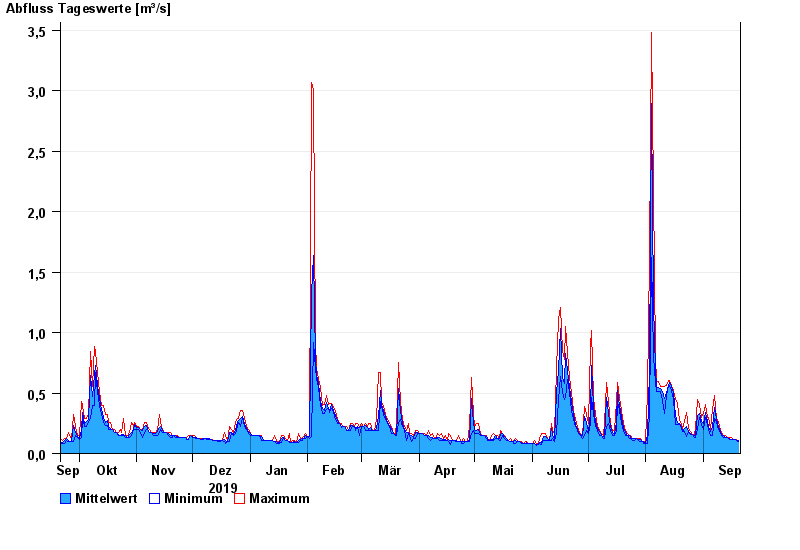
| Date | Mean value [m³/s] | Maximum [m³/s] | Minimum [m³/s] |
|---|---|---|---|
| 20.09.2020 | 0.109 | 0.111 | 0.096 |
| 19.09.2020 | 0.111 | 0.112 | 0.111 |
| 18.09.2020 | 0.112 | 0.112 | 0.112 |
| 17.09.2020 | 0.112 | 0.112 | 0.112 |
| 16.09.2020 | 0.113 | 0.129 | 0.112 |
| 15.09.2020 | 0.128 | 0.13 | 0.112 |
| 14.09.2020 | 0.13 | 0.13 | 0.13 |
© Bayerisches Landesamt für Umwelt 2024