

Chart of year Percha / Lüßbach
Discharge from 12.08.2021 to 11.08.2022
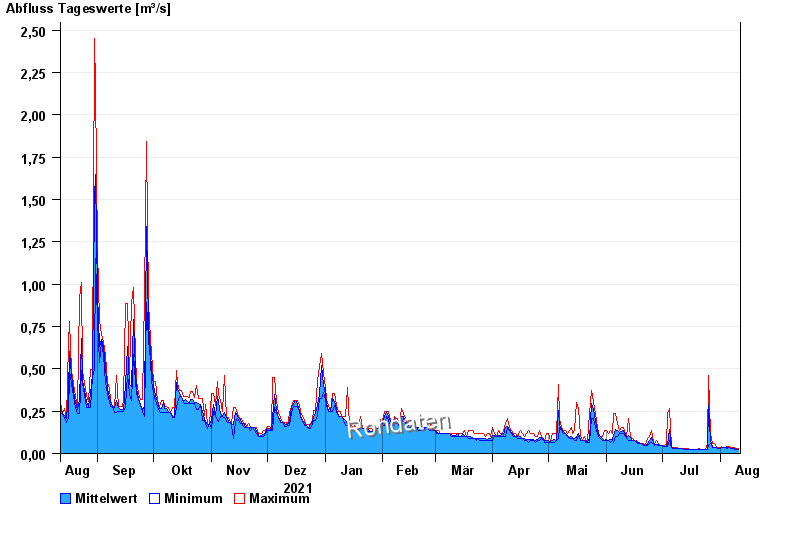
| Date | Mean value [m³/s] | Maximum [m³/s] | Minimum [m³/s] |
|---|---|---|---|
| 11.08.2022 | 0.024 | 0.03 | 0.021 |
| 10.08.2022 | 0.023 | 0.027 | 0.023 |
| 09.08.2022 | 0.028 | 0.033 | 0.023 |
| 08.08.2022 | 0.031 | 0.038 | 0.03 |
| 07.08.2022 | 0.032 | 0.033 | 0.03 |
| 06.08.2022 | 0.035 | 0.044 | 0.033 |
| 05.08.2022 | 0.033 | 0.044 | 0.03 |
© Bayerisches Landesamt für Umwelt 2024