

Chart of year Percha / Lüßbach
Discharge from 05.06.2020 to 04.06.2021
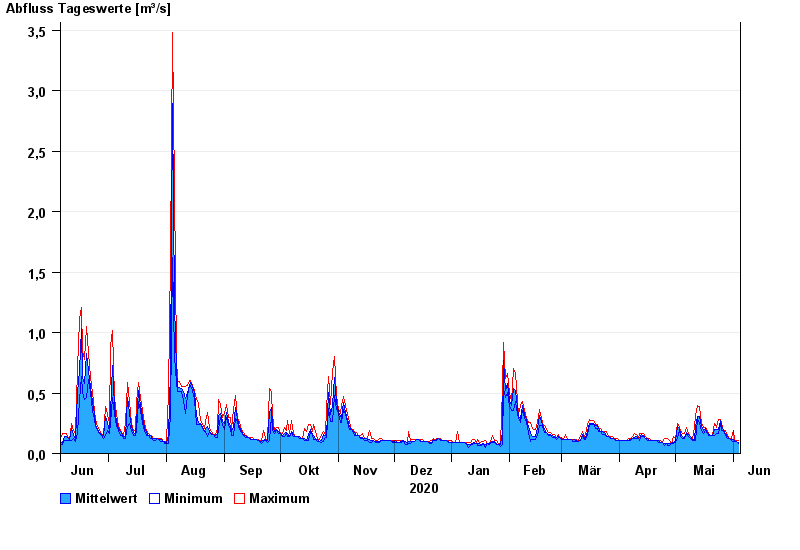
| Date | Mean value [m³/s] | Maximum [m³/s] | Minimum [m³/s] |
|---|---|---|---|
| 04.06.2021 | 0.093 | 0.111 | 0.083 |
| 03.06.2021 | 0.102 | 0.111 | 0.096 |
| 02.06.2021 | 0.11 | 0.111 | 0.096 |
| 01.06.2021 | 0.117 | 0.193 | 0.096 |
| 31.05.2021 | 0.118 | 0.127 | 0.11 |
| 30.05.2021 | 0.127 | 0.127 | 0.127 |
| 29.05.2021 | 0.143 | 0.146 | 0.127 |
© Bayerisches Landesamt für Umwelt 2024