

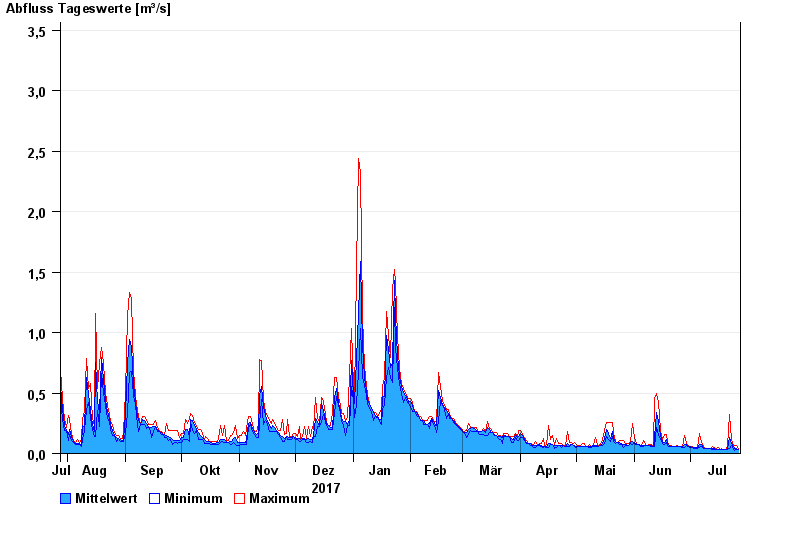
Chart of year Percha / Lüßbach
Discharge from 28.07.2017 to 27.07.2018
- 18.06.1979 Abfluss: 12,5 m³/s
- 19.07.1999 Abfluss: 8,92 m³/s
- 23.08.2005 Abfluss: 6,43 m³/s
- 22.05.1999 Abfluss: 6,26 m³/s
- 29.05.2007 Abfluss: 6,05 m³/s
| Date | Mean value [m³/s] | Maximum [m³/s] | Minimum [m³/s] |
|---|---|---|---|
| 27.07.2018 | 0.036 | 0.041 | 0.036 |
| 26.07.2018 | 0.042 | 0.064 | 0.036 |
| 25.07.2018 | 0.043 | 0.064 | 0.028 |
| 24.07.2018 | 0.055 | 0.065 | 0.029 |
| 23.07.2018 | 0.08 | 0.119 | 0.065 |
| 22.07.2018 | 0.132 | 0.326 | 0.038 |
| 21.07.2018 | 0.034 | 0.057 | 0.03 |
© Bayerisches Landesamt für Umwelt 2024