

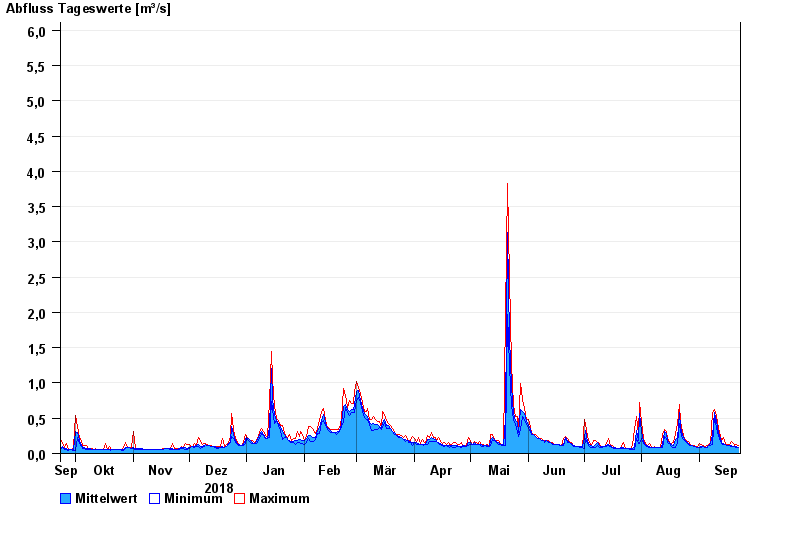
Chart of year Percha / Lüßbach
Discharge from 23.09.2018 to 22.09.2019
- 18.06.1979 Abfluss: 12,5 m³/s
- 19.07.1999 Abfluss: 8,92 m³/s
- 23.08.2005 Abfluss: 6,43 m³/s
- 22.05.1999 Abfluss: 6,26 m³/s
- 29.05.2007 Abfluss: 6,05 m³/s
| Date | Mean value [m³/s] | Maximum [m³/s] | Minimum [m³/s] |
|---|---|---|---|
| 22.09.2019 | 0.091 | 0.111 | 0.084 |
| 21.09.2019 | 0.097 | 0.128 | 0.084 |
| 20.09.2019 | 0.097 | 0.111 | 0.096 |
| 19.09.2019 | 0.1 | 0.146 | 0.096 |
| 18.09.2019 | 0.107 | 0.169 | 0.096 |
| 17.09.2019 | 0.111 | 0.127 | 0.11 |
| 16.09.2019 | 0.118 | 0.127 | 0.11 |
© Bayerisches Landesamt für Umwelt 2024