

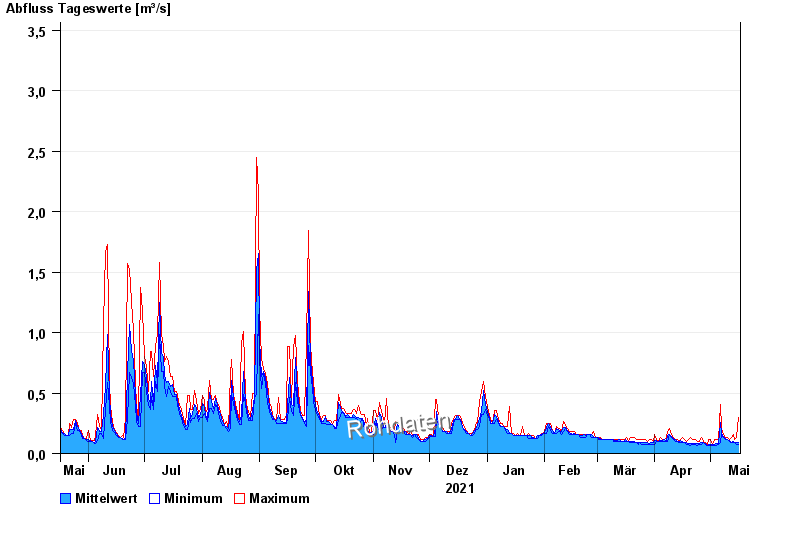
Chart of year Percha / Lüßbach
Discharge from 17.05.2021 to 16.05.2022
- 18.06.1979 Abfluss: 12,5 m³/s
- 19.07.1999 Abfluss: 8,92 m³/s
- 23.08.2005 Abfluss: 6,43 m³/s
- 22.05.1999 Abfluss: 6,26 m³/s
- 29.05.2007 Abfluss: 6,05 m³/s
| Date | Mean value [m³/s] | Maximum [m³/s] | Minimum [m³/s] |
|---|---|---|---|
| 16.05.2022 | 0.094 | 0.299 | 0.077 |
| 15.05.2022 | 0.091 | 0.136 | 0.077 |
| 14.05.2022 | 0.091 | 0.118 | 0.089 |
| 13.05.2022 | 0.102 | 0.156 | 0.089 |
| 12.05.2022 | 0.094 | 0.136 | 0.089 |
| 11.05.2022 | 0.105 | 0.118 | 0.102 |
| 10.05.2022 | 0.119 | 0.136 | 0.118 |
© Bayerisches Landesamt für Umwelt 2024