

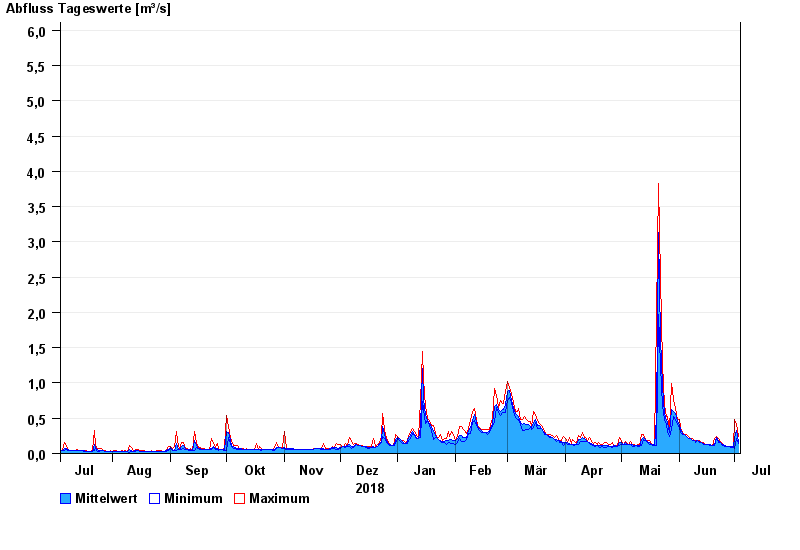
Chart of year Percha / Lüßbach
Discharge from 04.07.2018 to 03.07.2019
- 18.06.1979 Abfluss: 12,5 m³/s
- 19.07.1999 Abfluss: 8,92 m³/s
- 23.08.2005 Abfluss: 6,43 m³/s
- 22.05.1999 Abfluss: 6,26 m³/s
- 29.05.2007 Abfluss: 6,05 m³/s
| Date | Mean value [m³/s] | Maximum [m³/s] | Minimum [m³/s] |
|---|---|---|---|
| 03.07.2019 | 0.173 | 0.238 | 0.135 |
| 02.07.2019 | 0.324 | 0.409 | 0.208 |
| 01.07.2019 | 0.224 | 0.483 | 0.067 |
| 30.06.2019 | 0.096 | 0.101 | 0.088 |
| 29.06.2019 | 0.099 | 0.101 | 0.088 |
| 28.06.2019 | 0.101 | 0.101 | 0.101 |
| 27.06.2019 | 0.101 | 0.101 | 0.101 |
© Bayerisches Landesamt für Umwelt 2024