

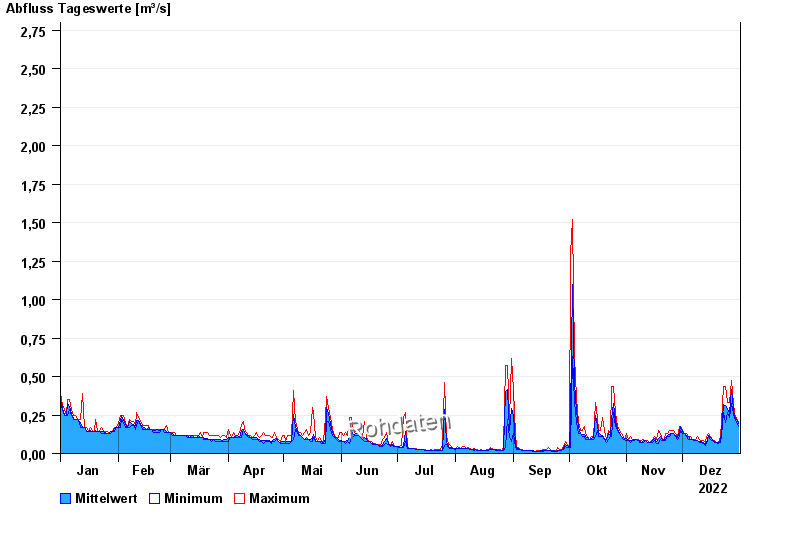
Chart of year Percha / Lüßbach
Discharge from 01.01.2022 to 31.12.2022
- 18.06.1979 Abfluss: 12,5 m³/s
- 19.07.1999 Abfluss: 8,92 m³/s
- 01.06.2024 Abfluss: 8,32 m³/s
- 02.06.2013 Abfluss: 7,34 m³/s
- 23.08.2005 Abfluss: 6,43 m³/s
| Date | Mean value [m³/s] | Maximum [m³/s] | Minimum [m³/s] |
|---|---|---|---|
| 31.12.2022 | 0.195 | 0.197 | 0.172 |
| 30.12.2022 | 0.22 | 0.225 | 0.197 |
| 29.12.2022 | 0.236 | 0.256 | 0.225 |
| 28.12.2022 | 0.284 | 0.323 | 0.256 |
| 27.12.2022 | 0.411 | 0.471 | 0.323 |
| 26.12.2022 | 0.351 | 0.433 | 0.323 |
| 25.12.2022 | 0.389 | 0.432 | 0.358 |
© Bayerisches Landesamt für Umwelt 2025