
- Start >
- Rivers >
- Discharge >
- Isar >
- Peißenberg >
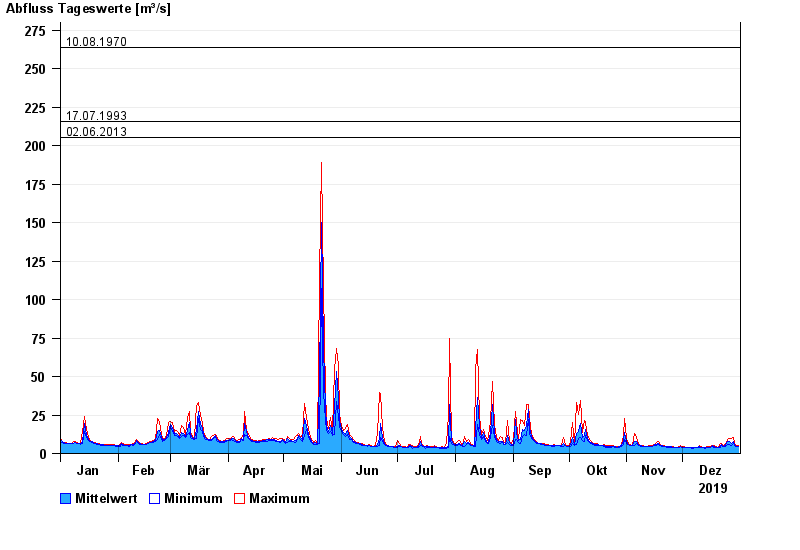
- Chart of year

Chart of year Peißenberg / Ammer
Discharge from 01.01.2019 to 31.12.2019
- 22.05.1999 Abfluss: 435 m³/s
- 23.08.2005 Abfluss: 355 m³/s
- 10.08.1970 Abfluss: 264 m³/s
- 17.07.1993 Abfluss: 216 m³/s
- 02.06.2013 Abfluss: 205 m³/s
| Date | Mean value [m³/s] | Maximum [m³/s] | Minimum [m³/s] |
|---|---|---|---|
| 31.12.2019 | 4.52 | 4.91 | 4.39 |
| 30.12.2019 | 4.8 | 5.19 | 4.39 |
| 29.12.2019 | 5.59 | 6.46 | 5.19 |
| 28.12.2019 | 7.86 | 10.1 | 6.46 |
| 27.12.2019 | 6.47 | 9.68 | 5.48 |
| 26.12.2019 | 7.48 | 9.68 | 6.12 |
| 25.12.2019 | 7.6 | 9.23 | 5.79 |
© Bayerisches Landesamt für Umwelt 2024