
- Start >
- Rivers >
- Discharge >
- Isar >
- Peißenberg >
- Chart of year

Chart of year Peißenberg / Ammer
Discharge from 01.01.2024 to 01.05.2024
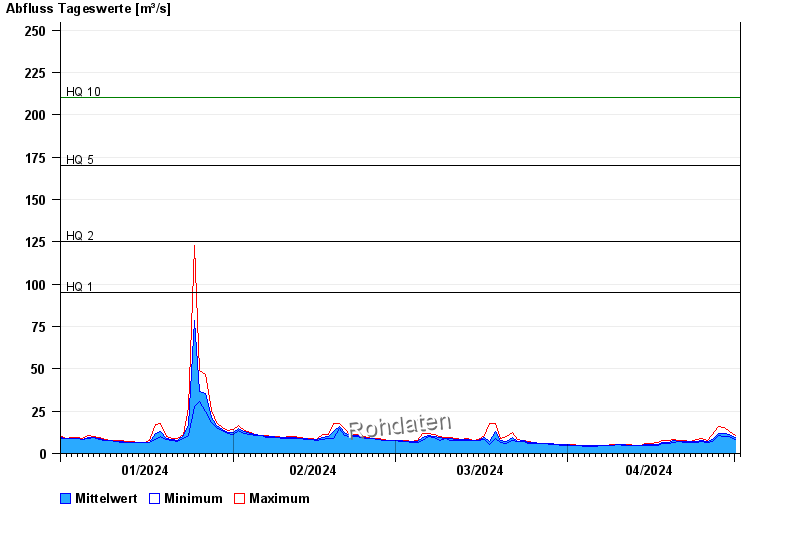
- HQ1 95 m³/s
- HQ2 125 m³/s
- HQ5 170 m³/s
- HQ10 210 m³/s
- HQ20 255 m³/s
- HQ50 325 m³/s
- HQ100 390 m³/s
| Date | Mean value [m³/s] | Maximum [m³/s] | Minimum [m³/s] |
|---|---|---|---|
| 01.05.2024 | 9.23 | 10.4 | 8.11 |
| 30.04.2024 | 11.2 | 13 | 9.9 |
| 29.04.2024 | 12 | 15.3 | 9.9 |
| 28.04.2024 | 11.9 | 15.9 | 10.4 |
| 27.04.2024 | 8.19 | 11.4 | 6.94 |
| 26.04.2024 | 7.18 | 7.72 | 6.55 |
| 25.04.2024 | 7.77 | 8.98 | 7.31 |
© Bayerisches Landesamt für Umwelt 2024