

Chart of year Operding / Hammerbach
Discharge from 31.07.2020 to 30.07.2021
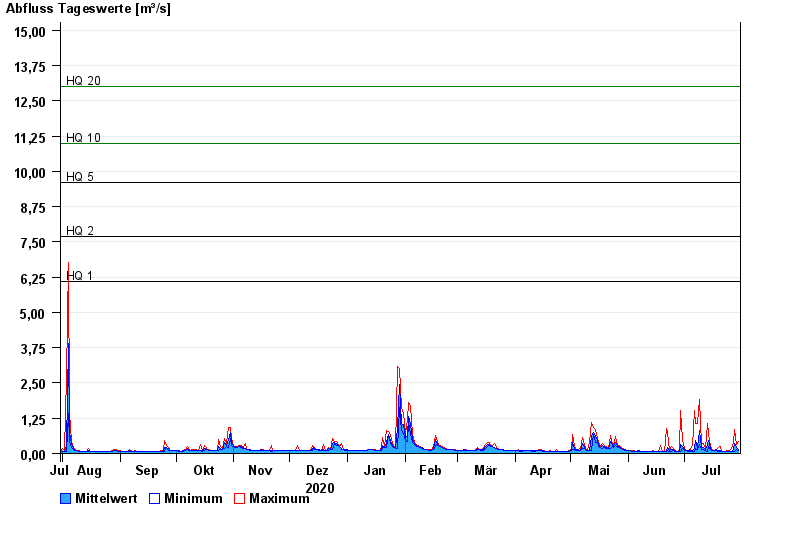
- HQ1 6,1 m³/s
- HQ2 7,7 m³/s
- HQ5 9,6 m³/s
- HQ10 11 m³/s
- HQ20 13 m³/s
- HQ50 16 m³/s
- HQ100 19 m³/s
| Date | Mean value [m³/s] | Maximum [m³/s] | Minimum [m³/s] |
|---|---|---|---|
| 30.07.2021 | 0.142 | 0.427 | 0.098 |
| 29.07.2021 | 0.205 | 0.335 | 0.139 |
| 28.07.2021 | 0.341 | 0.862 | 0.087 |
| 27.07.2021 | 0.146 | 0.373 | 0.084 |
| 26.07.2021 | 0.075 | 0.179 | 0.056 |
| 25.07.2021 | 0.076 | 0.091 | 0.061 |
| 24.07.2021 | 0.062 | 0.098 | 0.056 |
© Bayerisches Landesamt für Umwelt 2024