

Chart of year Operding / Hammerbach
Discharge from 30.09.2021 to 29.09.2022
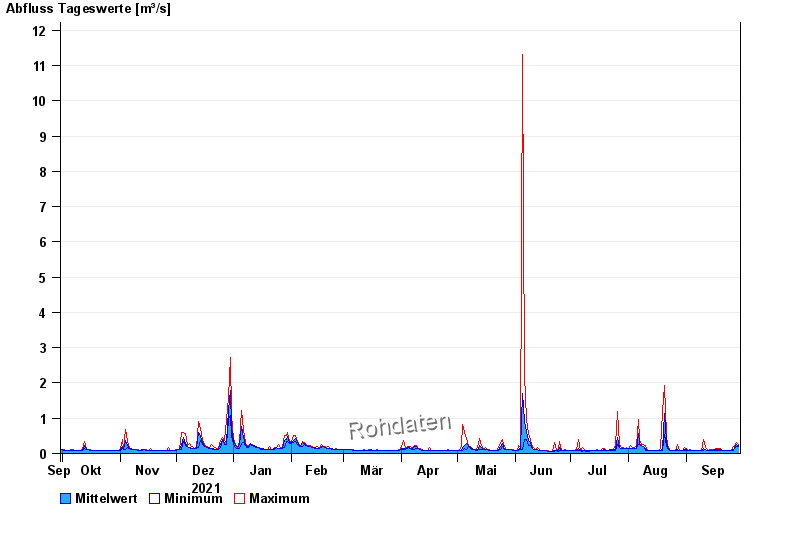
| Date | Mean value [m³/s] | Maximum [m³/s] | Minimum [m³/s] |
|---|---|---|---|
| 29.09.2022 | 0.23 | 0.268 | 0.191 |
| 28.09.2022 | 0.266 | 0.325 | 0.191 |
| 27.09.2022 | 0.148 | 0.191 | 0.128 |
| 26.09.2022 | 0.111 | 0.191 | 0.096 |
| 25.09.2022 | 0.096 | 0.096 | 0.096 |
| 24.09.2022 | 0.096 | 0.096 | 0.096 |
| 23.09.2022 | 0.096 | 0.096 | 0.096 |
© Bayerisches Landesamt für Umwelt 2024