

Chart of year Operding / Hammerbach
Discharge from 01.01.2023 to 31.12.2023
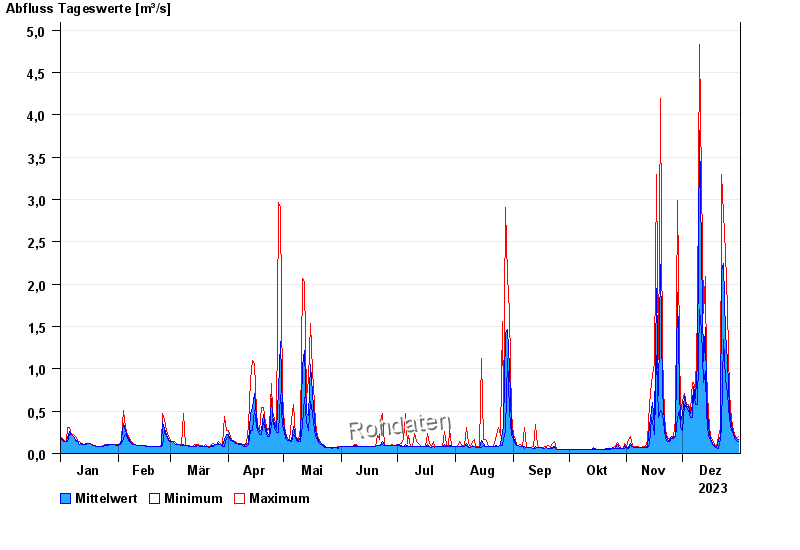
| Date | Mean value [m³/s] | Maximum [m³/s] | Minimum [m³/s] |
|---|---|---|---|
| 31.12.2023 | 0.162 | 0.2 | 0.138 |
| 30.12.2023 | 0.176 | 0.178 | 0.157 |
| 29.12.2023 | 0.199 | 0.223 | 0.178 |
| 28.12.2023 | 0.239 | 0.275 | 0.223 |
| 27.12.2023 | 0.328 | 0.397 | 0.275 |
| 26.12.2023 | 0.518 | 0.703 | 0.397 |
| 25.12.2023 | 1.1 | 1.7 | 0.703 |
© Bayerisches Landesamt für Umwelt 2024