

Chart of year Operding / Hammerbach
Discharge from 26.09.2020 to 25.09.2021
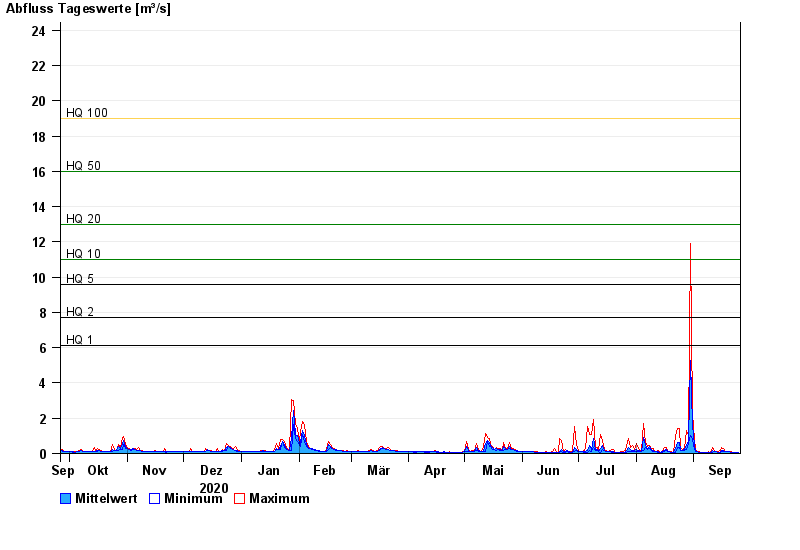
- HQ1 6,1 m³/s
- HQ2 7,7 m³/s
- HQ5 9,6 m³/s
- HQ10 11 m³/s
- HQ20 13 m³/s
- HQ50 16 m³/s
- HQ100 19 m³/s
| Date | Mean value [m³/s] | Maximum [m³/s] | Minimum [m³/s] |
|---|---|---|---|
| 25.09.2021 | 0.075 | 0.075 | 0.075 |
| 24.09.2021 | 0.075 | 0.081 | 0.075 |
| 23.09.2021 | 0.081 | 0.081 | 0.081 |
| 22.09.2021 | 0.081 | 0.081 | 0.081 |
| 21.09.2021 | 0.081 | 0.087 | 0.081 |
| 20.09.2021 | 0.088 | 0.094 | 0.087 |
| 19.09.2021 | 0.095 | 0.101 | 0.094 |
© Bayerisches Landesamt für Umwelt 2024