

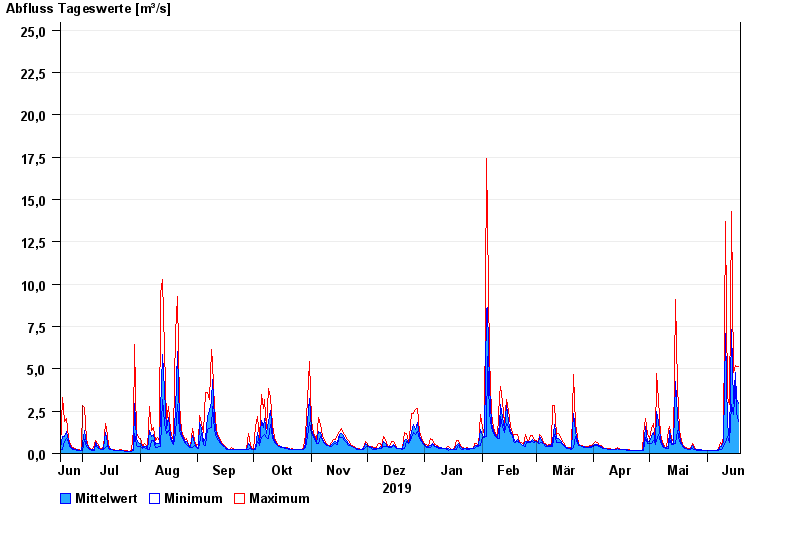
Chart of year Obernach / Ach
Discharge from 19.06.2019 to 18.06.2020
- 22.05.1999 Abfluss: 85,5 m³/s
- 31.07.1990 Abfluss: 62,9 m³/s
- 03.02.1970 Abfluss: 59 m³/s
- 31.07.1990 Abfluss: 54,4 m³/s
- 15.01.1968 Abfluss: 54,3 m³/s
| Date | Mean value [m³/s] | Maximum [m³/s] | Minimum [m³/s] |
|---|---|---|---|
| 18.06.2020 | 2.96 | 5.12 | 1.9 |
| 17.06.2020 | 3.2 | 5.12 | 2.45 |
| 16.06.2020 | 4.76 | 5.17 | 3.95 |
| 15.06.2020 | 2.98 | 4.79 | 2.3 |
| 14.06.2020 | 7.3 | 14.3 | 2.87 |
| 13.06.2020 | 0.823 | 2.87 | 0.628 |
| 12.06.2020 | 1.73 | 3.32 | 1.01 |
© Bayerisches Landesamt für Umwelt 2024