

Chart of year Obernach / Ach
Discharge from 01.01.2019 to 31.12.2019
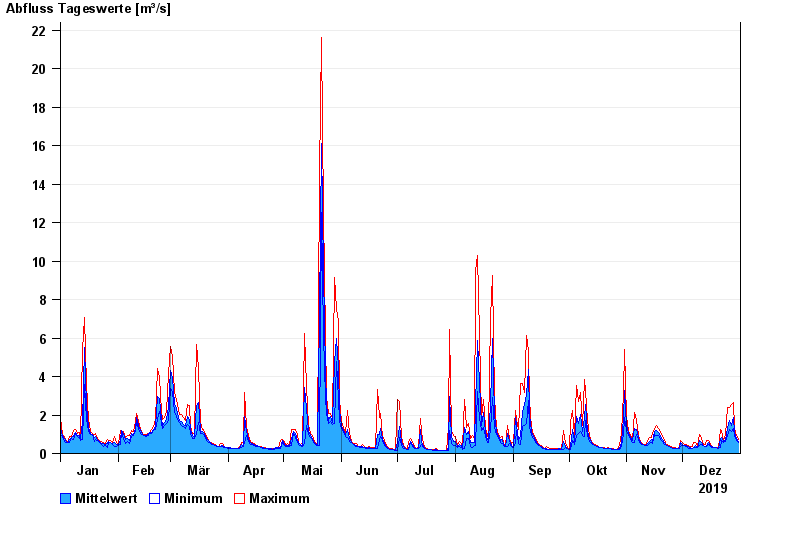
| Date | Mean value [m³/s] | Maximum [m³/s] | Minimum [m³/s] |
|---|---|---|---|
| 31.12.2019 | 0.638 | 0.746 | 0.584 |
| 30.12.2019 | 0.772 | 0.924 | 0.69 |
| 29.12.2019 | 1.08 | 1.32 | 0.863 |
| 28.12.2019 | 1.86 | 2.67 | 1.32 |
| 27.12.2019 | 1.43 | 2.57 | 1.12 |
| 26.12.2019 | 1.7 | 2.38 | 1.25 |
| 25.12.2019 | 1.32 | 2.38 | 0.925 |
© Bayerisches Landesamt für Umwelt 2024