

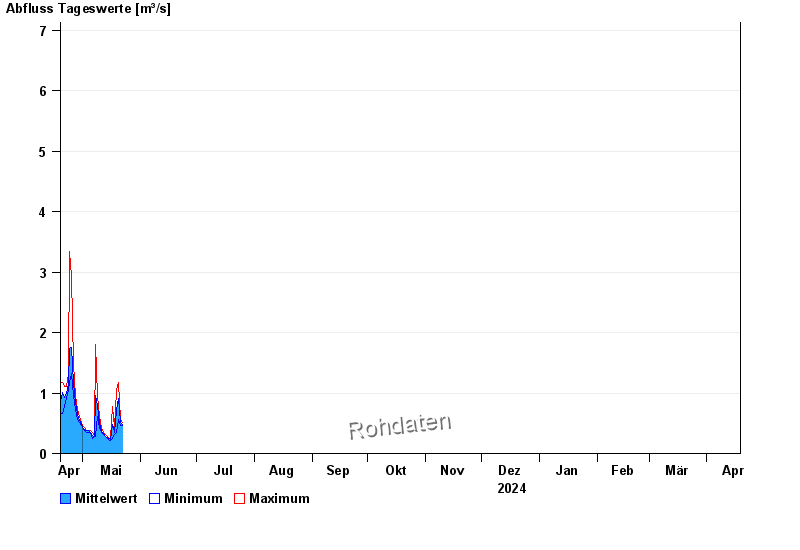
Chart of year Obernach / Ach
Discharge from 19.04.2024 to 18.04.2025
- HQ1 25 m³/s
- HQ2 32 m³/s
- HQ5 38 m³/s
- HQ10 45 m³/s
- HQ20 52 m³/s
- HQ50 63 m³/s
- HQ100 70 m³/s
| Date | Mean value [m³/s] | Maximum [m³/s] | Minimum [m³/s] |
|---|---|---|---|
| 01.05.2024 | 0.436 | 0.468 | 0.425 |
| 30.04.2024 | 0.479 | 0.514 | 0.468 |
| 29.04.2024 | 0.54 | 0.612 | 0.514 |
| 28.04.2024 | 0.647 | 0.721 | 0.561 |
| 27.04.2024 | 0.842 | 0.965 | 0.721 |
| 26.04.2024 | 1.16 | 1.48 | 0.965 |
| 25.04.2024 | 1.75 | 2.92 | 1.32 |
© Bayerisches Landesamt für Umwelt 2024